Climate Change Chart of Sousse, Tunisia
Comprehensive Climate Change Chart of Sousse, Tunisia: Monthly Averages and Impact Trends
Explore the changing climate in Sousse, Tunisia, with insights from temperature, rainfall, and sunshine duration data. Discover how the climate has evolved from 1940-1950 to 2013-2024.
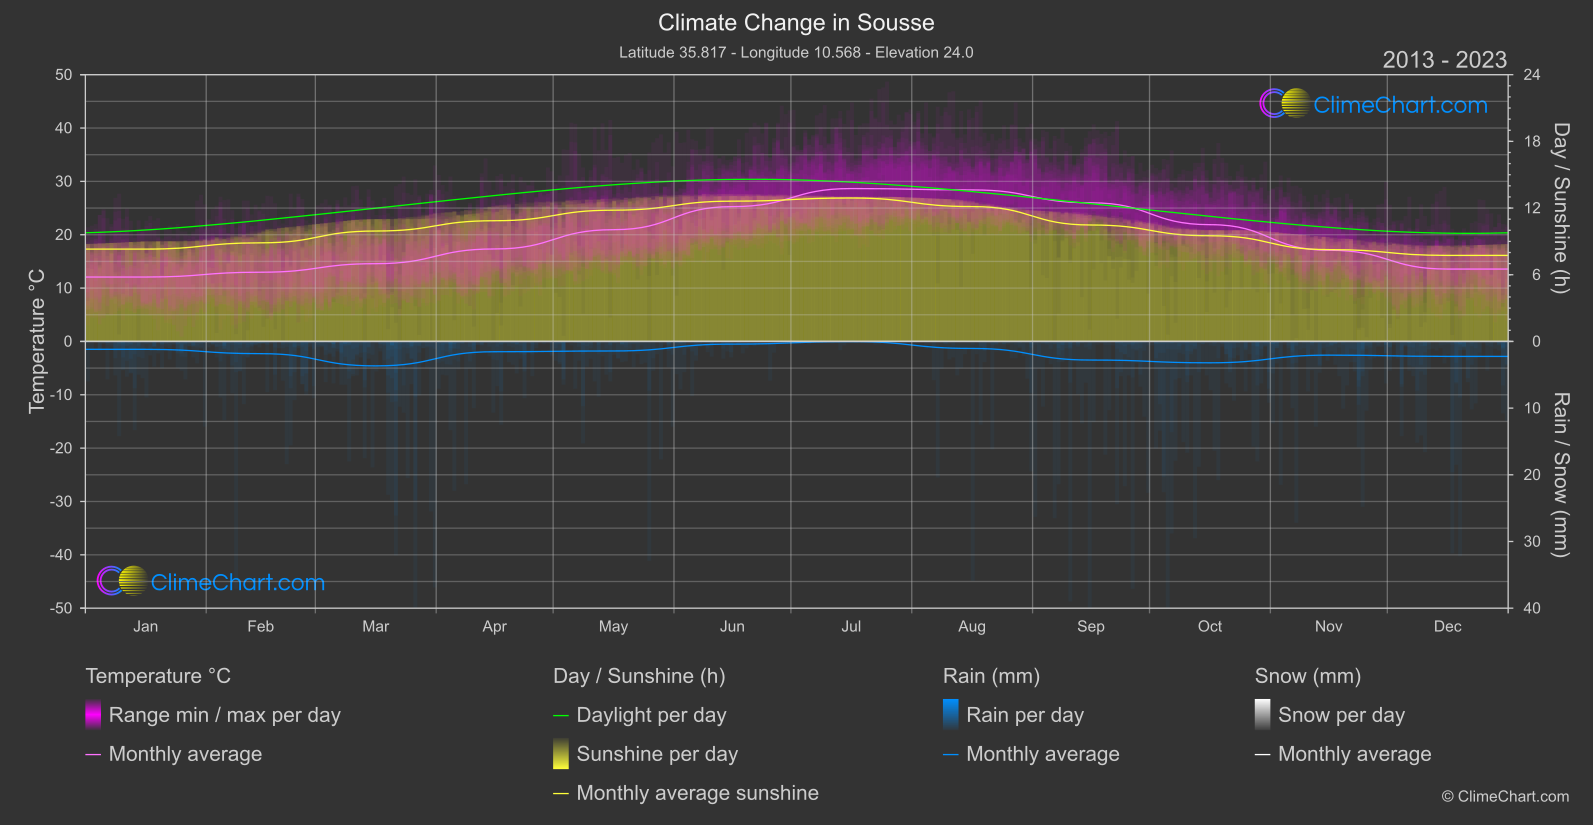
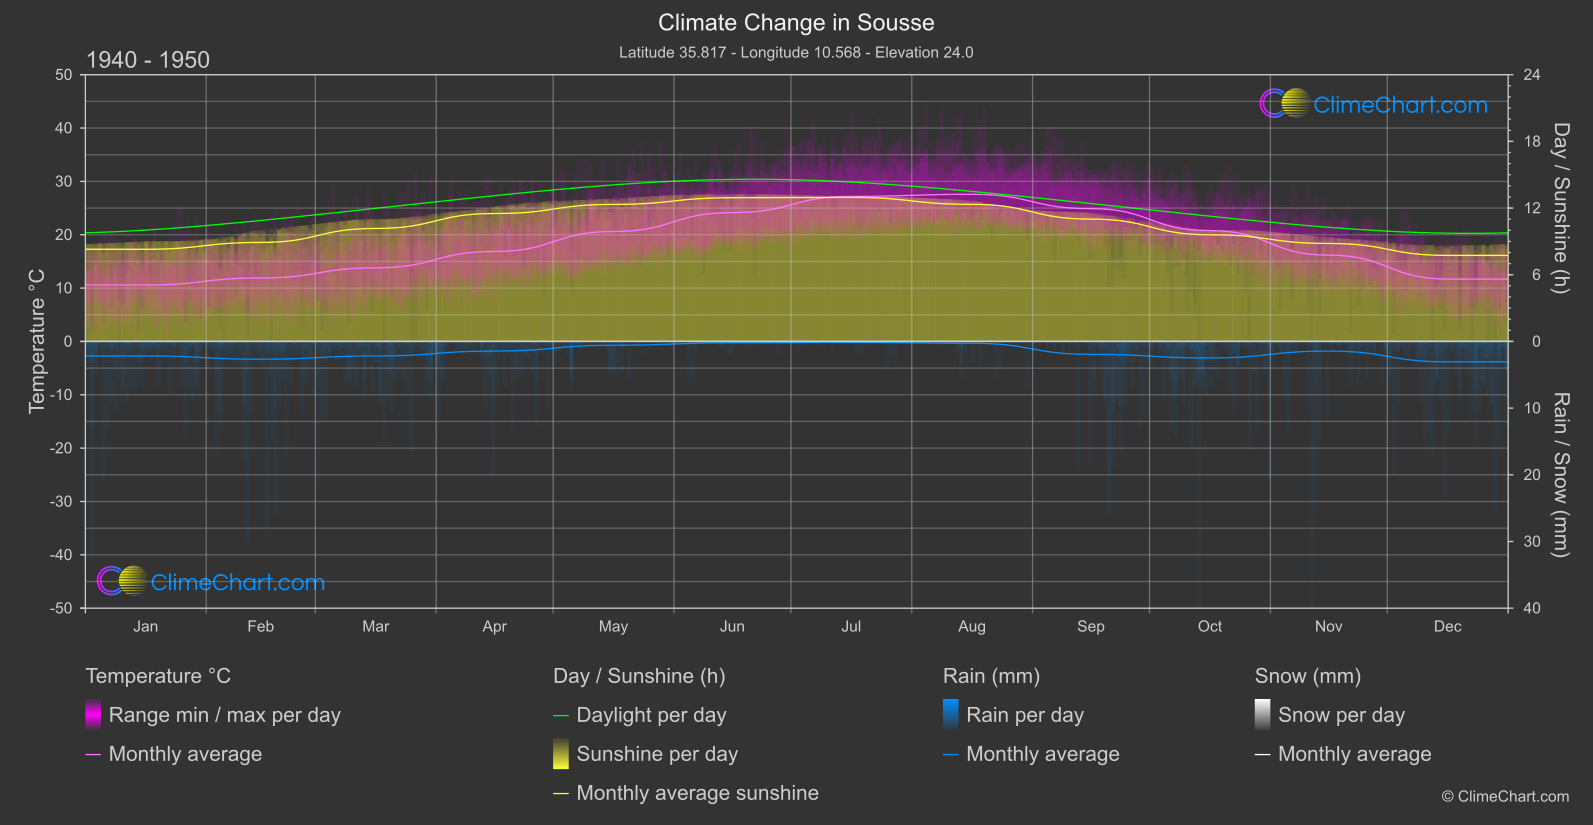
Sousse, Tunisia, experiences a noticeable increase in temperature from January to July, with June showing the highest temperature change. The data also reveals fluctuations in rainfall, with March and September exhibiting significant changes. Sunshine duration varies throughout the year, with the biggest drop in November. These insights showcase the impact of climate change on Sousse's weather patterns over the decades.
Climate Change Data Overview for Sousse, Tunisia
Explore the comprehensive climate change data for Sousse, Tunisia. This detailed table provides valuable insights into temperature variations, precipitation levels, and seasonal changes influenced by climate change, helping you understand the unique weather patterns of this region.
Temperature °C
| Month | ⌀ 1940 - 1950 | ⌀ 2013 - 2023 | +/- |
|---|---|---|---|
| Jan | 10.58 | 12.07 | 1.49 |
| Feb | 11.89 | 12.97 | 1.08 |
| Mar | 13.79 | 14.57 | 0.78 |
| Apr | 16.87 | 17.33 | 0.47 |
| May | 20.61 | 20.95 | 0.34 |
| Jun | 24.15 | 25.27 | 1.12 |
| Jul | 27.19 | 28.66 | 1.47 |
| Aug | 27.58 | 28.40 | 0.82 |
| Sep | 24.89 | 25.98 | 1.10 |
| Oct | 20.77 | 21.89 | 1.11 |
| Nov | 16.17 | 17.09 | 0.92 |
| Dec | 11.69 | 13.56 | 1.87 |
| ⌀ Month | 18.85 | 19.90 | 1.05 |
Sunshine (h)
| Month | ⌀ 1940 - 1950 | ⌀ 2013 - 2023 | +/- |
|---|---|---|---|
| Jan | 8.29 | 8.31 | 0.01 |
| Feb | 8.91 | 8.87 | -0.04 |
| Mar | 10.17 | 9.93 | -0.23 |
| Apr | 11.51 | 10.86 | -0.65 |
| May | 12.33 | 11.81 | -0.52 |
| Jun | 12.93 | 12.62 | -0.31 |
| Jul | 12.96 | 12.90 | -0.05 |
| Aug | 12.33 | 12.13 | -0.20 |
| Sep | 11.00 | 10.48 | -0.53 |
| Oct | 9.60 | 9.51 | -0.09 |
| Nov | 8.81 | 8.26 | -0.55 |
| Dec | 7.74 | 7.74 | 0.00 |
| ⌀ Month | 10.55 | 10.29 | -0.26 |
Rain (mm)
| Month | ⌀ 1940 - 1950 | ⌀ 2013 - 2023 | +/- |
|---|---|---|---|
| Jan | 1.09 | 0.59 | -0.49 |
| Feb | 1.33 | 0.92 | -0.42 |
| Mar | 1.09 | 1.83 | 0.74 |
| Apr | 0.72 | 0.77 | 0.05 |
| May | 0.29 | 0.71 | 0.43 |
| Jun | 0.10 | 0.20 | 0.10 |
| Jul | 0.07 | 0.01 | -0.06 |
| Aug | 0.14 | 0.53 | 0.39 |
| Sep | 0.97 | 1.40 | 0.43 |
| Oct | 1.24 | 1.60 | 0.36 |
| Nov | 0.72 | 1.03 | 0.30 |
| Dec | 1.53 | 1.12 | -0.41 |
| ⌀ Month | 0.77 | 0.89 | 0.12 |
Snow (mm)
| Month | ⌀ 1940 - 1950 | ⌀ 2013 - 2023 | +/- |
|---|---|---|---|
| Jan | 0.00 | 0.00 | 0.00 |
| Feb | 0.00 | 0.00 | 0.00 |
| Mar | 0.00 | 0.00 | 0.00 |
| Apr | 0.00 | 0.00 | 0.00 |
| May | 0.00 | 0.00 | 0.00 |
| Jun | 0.00 | 0.00 | 0.00 |
| Jul | 0.00 | 0.00 | 0.00 |
| Aug | 0.00 | 0.00 | 0.00 |
| Sep | 0.00 | 0.00 | 0.00 |
| Oct | 0.00 | 0.00 | 0.00 |
| Nov | 0.00 | 0.00 | 0.00 |
| Dec | 0.00 | 0.00 | 0.00 |
| ⌀ Month | 0.00 | 0.00 | 0.00 |