Climate Change Chart of Sölden, Austria
Comprehensive Climate Change Chart of Sölden, Austria: Monthly Averages and Impact Trends
Explore the changing climate in Sölden, Austria, with insightful data analysis. Discover how temperature, rainfall, snowfall, and sunshine duration have evolved from 1940-1950 to 2013-2024.
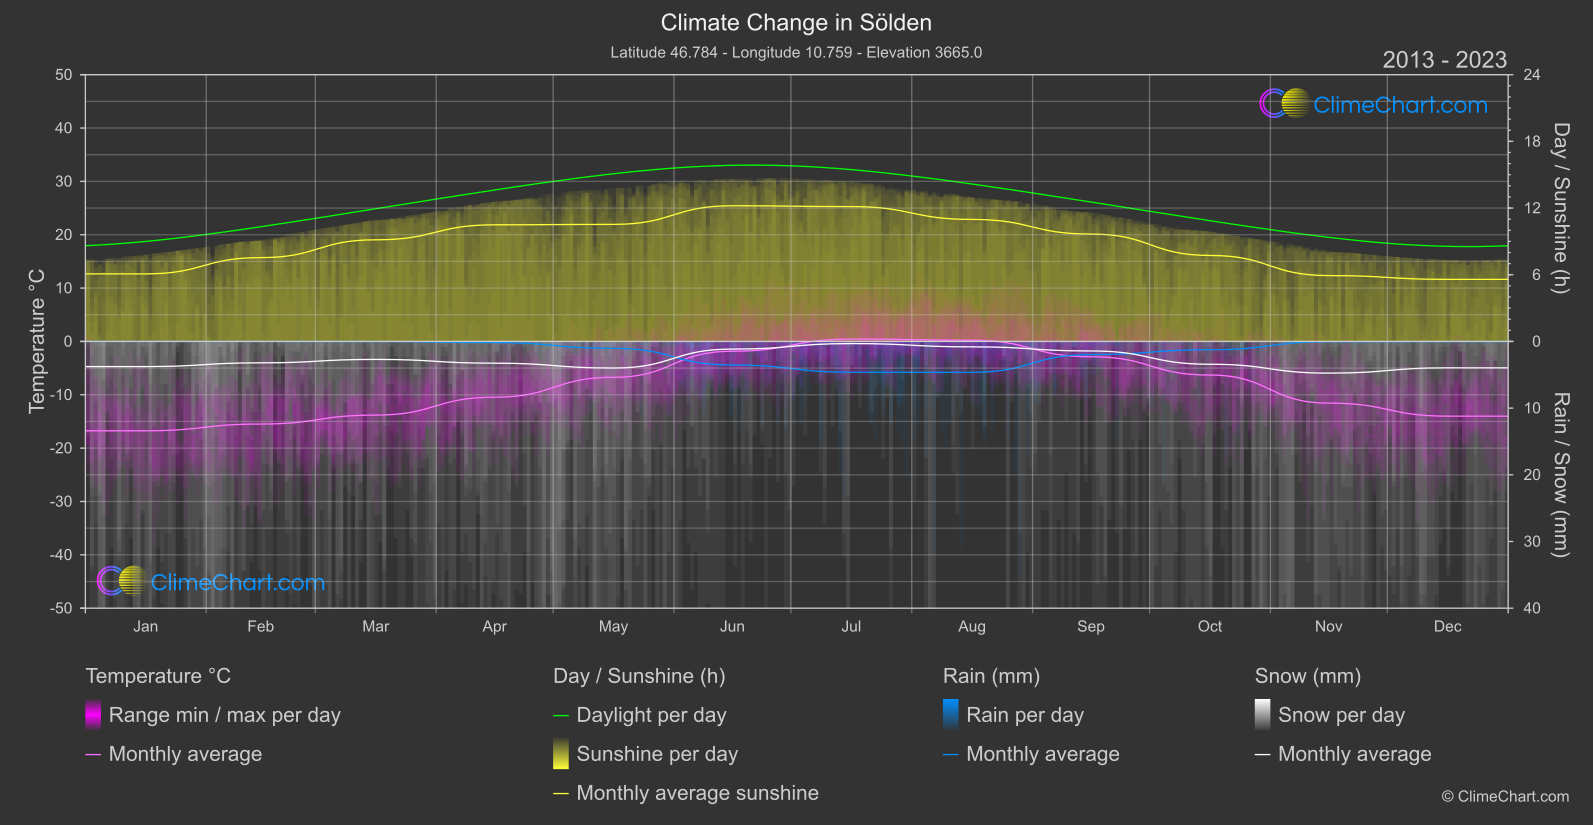
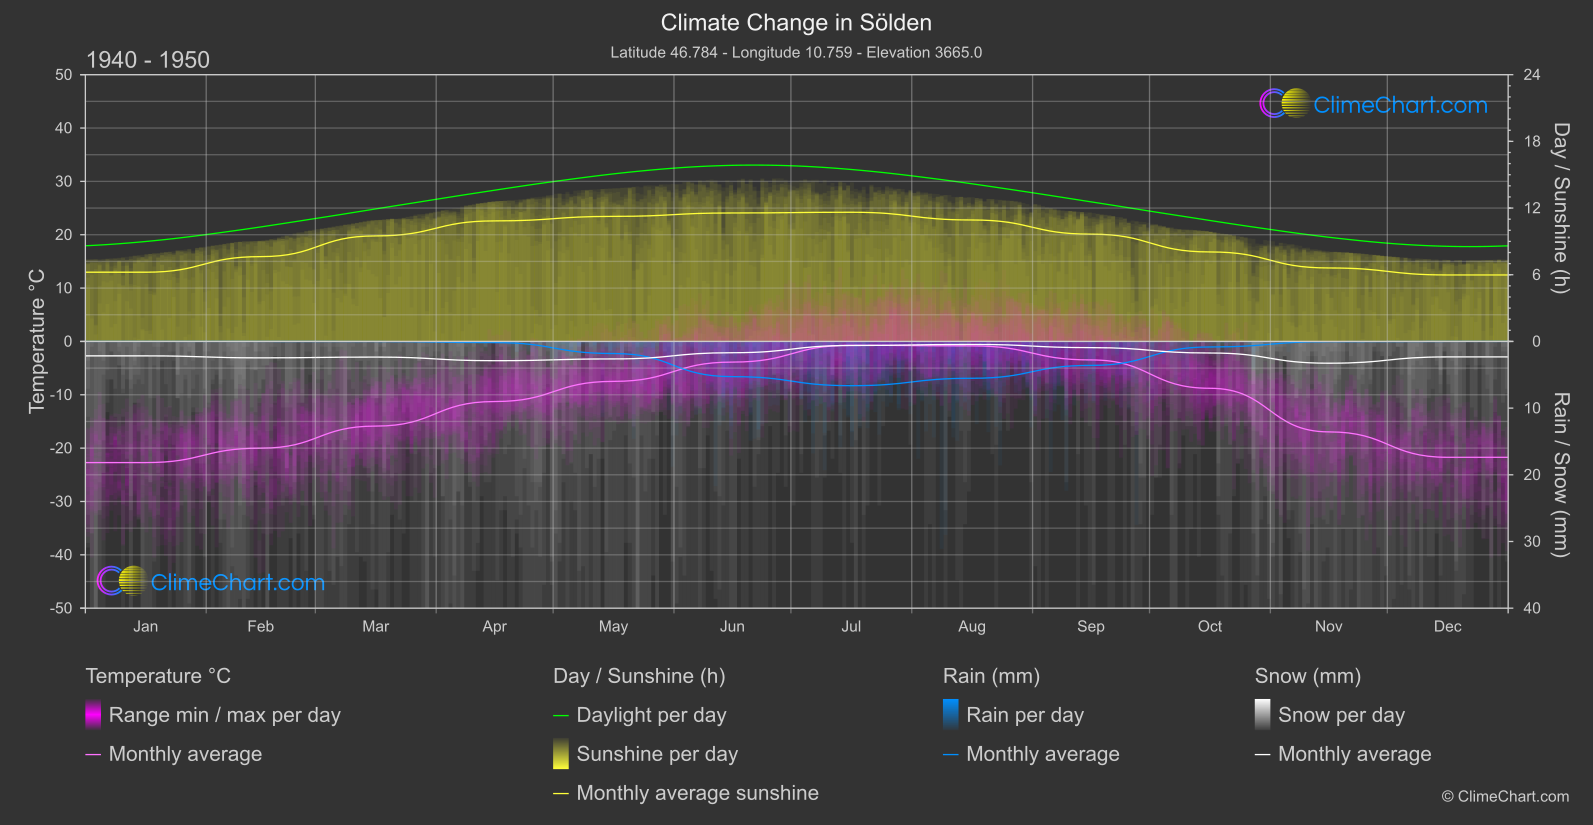
Sölden, Austria, has experienced notable changes in climate over the years. In terms of temperature, the month with the highest change is December, with a significant increase of 7.71°C from 1940-1950 to 2013-2024. When it comes to rainfall, May has seen the most drastic change, with a decrease of 39.03 mm. Snowfall has decreased in June by 27.26 mm. Interestingly, sunshine duration has seen varying changes across the months, with the most significant decrease in November by 68.67 hours.
Climate Change Data Overview for Sölden, Austria
Explore the comprehensive climate change data for Sölden, Austria. This detailed table provides valuable insights into temperature variations, precipitation levels, and seasonal changes influenced by climate change, helping you understand the unique weather patterns of this region.
Temperature °C
| Month | ⌀ 1940 - 1950 | ⌀ 2013 - 2023 | +/- |
|---|---|---|---|
| Jan | -22.71 | -16.75 | 5.96 |
| Feb | -20.01 | -15.48 | 4.52 |
| Mar | -15.87 | -13.81 | 2.06 |
| Apr | -11.27 | -10.45 | 0.81 |
| May | -7.49 | -6.72 | 0.77 |
| Jun | -3.87 | -1.84 | 2.03 |
| Jul | -0.72 | 0.45 | 1.17 |
| Aug | -0.84 | 0.23 | 1.07 |
| Sep | -3.47 | -2.87 | 0.60 |
| Oct | -8.78 | -6.30 | 2.48 |
| Nov | -16.95 | -11.56 | 5.39 |
| Dec | -21.72 | -14.01 | 7.71 |
| ⌀ Month | -11.14 | -8.26 | 2.88 |
Sunshine (h)
| Month | ⌀ 1940 - 1950 | ⌀ 2013 - 2023 | +/- |
|---|---|---|---|
| Jan | 6.23 | 6.08 | -0.15 |
| Feb | 7.63 | 7.54 | -0.09 |
| Mar | 9.49 | 9.14 | -0.35 |
| Apr | 10.85 | 10.49 | -0.35 |
| May | 11.25 | 10.53 | -0.72 |
| Jun | 11.56 | 12.21 | 0.65 |
| Jul | 11.62 | 12.13 | 0.51 |
| Aug | 10.93 | 10.98 | 0.05 |
| Sep | 9.65 | 9.66 | 0.01 |
| Oct | 8.05 | 7.74 | -0.32 |
| Nov | 6.61 | 5.92 | -0.69 |
| Dec | 5.98 | 5.58 | -0.40 |
| ⌀ Month | 9.15 | 9.00 | -0.15 |
Rain (mm)
| Month | ⌀ 1940 - 1950 | ⌀ 2013 - 2023 | +/- |
|---|---|---|---|
| Jan | 0.00 | 0.01 | 0.01 |
| Feb | 0.00 | 0.01 | 0.01 |
| Mar | 0.00 | 0.01 | 0.00 |
| Apr | 0.09 | 0.09 | -0.00 |
| May | 0.91 | 0.52 | -0.39 |
| Jun | 2.64 | 1.77 | -0.87 |
| Jul | 3.32 | 2.31 | -1.01 |
| Aug | 2.76 | 2.31 | -0.45 |
| Sep | 1.80 | 0.99 | -0.81 |
| Oct | 0.41 | 0.62 | 0.20 |
| Nov | 0.02 | 0.02 | 0.01 |
| Dec | 0.00 | 0.01 | 0.01 |
| ⌀ Month | 1.00 | 0.72 | -0.27 |
Snow (mm)
| Month | ⌀ 1940 - 1950 | ⌀ 2013 - 2023 | +/- |
|---|---|---|---|
| Jan | 1.08 | 1.89 | 0.80 |
| Feb | 1.23 | 1.60 | 0.37 |
| Mar | 1.17 | 1.35 | 0.17 |
| Apr | 1.44 | 1.63 | 0.19 |
| May | 1.31 | 1.99 | 0.68 |
| Jun | 0.85 | 0.57 | -0.27 |
| Jul | 0.30 | 0.16 | -0.14 |
| Aug | 0.22 | 0.41 | 0.18 |
| Sep | 0.46 | 0.71 | 0.25 |
| Oct | 0.87 | 1.71 | 0.84 |
| Nov | 1.63 | 2.38 | 0.74 |
| Dec | 1.16 | 1.98 | 0.82 |
| ⌀ Month | 0.98 | 1.37 | 0.39 |