Climate Change Chart of Snowbird, USA
Comprehensive Climate Change Chart of Snowbird, USA: Monthly Averages and Impact Trends
Exploring the changing climate patterns in Snowbird, United States of America reveals intriguing insights. Discover how temperature, rainfall, snowfall, and sunshine duration have evolved over the years.
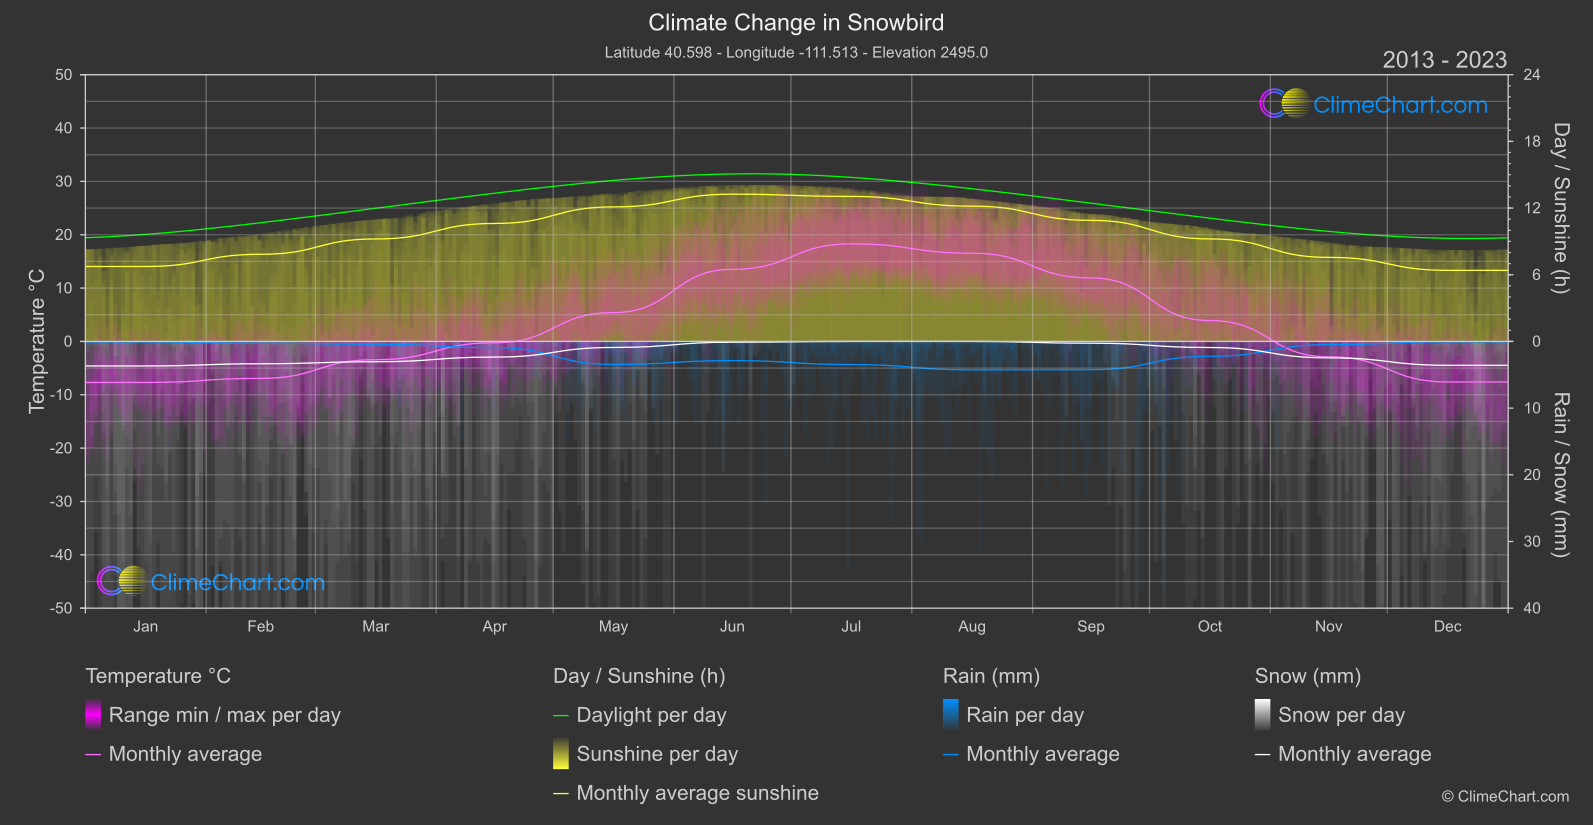
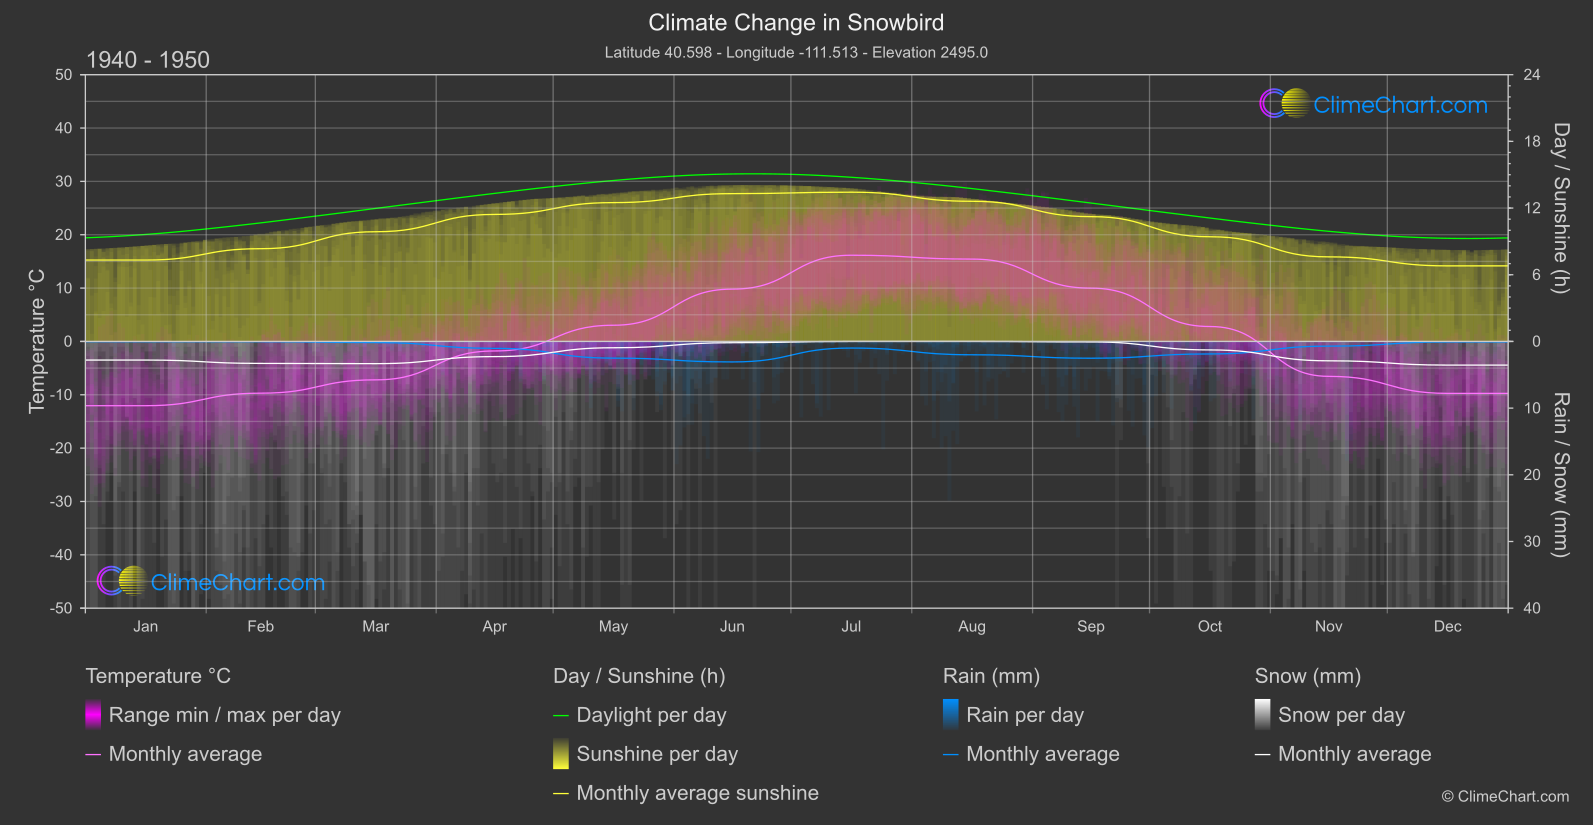
Snowbird in the United States has experienced notable shifts in climate variables from the 1940s to the 2020s. The data shows that June witnessed a significant increase in average temperature, while July had a substantial rise in rainfall. Interestingly, snowfall in Snowbird has decreased over the years, especially in November. Moreover, sunshine duration has shown a general decreasing trend over the decades.
Climate Change Data Overview for Snowbird, USA
Explore the comprehensive climate change data for Snowbird, USA. This detailed table provides valuable insights into temperature variations, precipitation levels, and seasonal changes influenced by climate change, helping you understand the unique weather patterns of this region.
Temperature °C
| Month | ⌀ 1940 - 1950 | ⌀ 2013 - 2023 | +/- |
|---|---|---|---|
| Jan | -12.04 | -7.69 | 4.35 |
| Feb | -9.70 | -6.93 | 2.77 |
| Mar | -7.20 | -3.42 | 3.78 |
| Apr | -1.79 | -0.25 | 1.53 |
| May | 3.03 | 5.41 | 2.37 |
| Jun | 9.81 | 13.51 | 3.70 |
| Jul | 16.16 | 18.29 | 2.13 |
| Aug | 15.43 | 16.53 | 1.10 |
| Sep | 9.99 | 11.89 | 1.91 |
| Oct | 2.80 | 3.91 | 1.12 |
| Nov | -6.55 | -2.87 | 3.67 |
| Dec | -9.74 | -7.60 | 2.14 |
| ⌀ Month | 0.85 | 3.40 | 2.55 |
Sunshine (h)
| Month | ⌀ 1940 - 1950 | ⌀ 2013 - 2023 | +/- |
|---|---|---|---|
| Jan | 7.32 | 6.74 | -0.58 |
| Feb | 8.34 | 7.84 | -0.50 |
| Mar | 9.87 | 9.22 | -0.65 |
| Apr | 11.43 | 10.61 | -0.81 |
| May | 12.49 | 12.10 | -0.39 |
| Jun | 13.30 | 13.25 | -0.05 |
| Jul | 13.43 | 13.05 | -0.38 |
| Aug | 12.61 | 12.17 | -0.44 |
| Sep | 11.23 | 10.89 | -0.34 |
| Oct | 9.42 | 9.22 | -0.19 |
| Nov | 7.61 | 7.56 | -0.05 |
| Dec | 6.80 | 6.39 | -0.40 |
| ⌀ Month | 10.32 | 9.92 | -0.40 |
Rain (mm)
| Month | ⌀ 1940 - 1950 | ⌀ 2013 - 2023 | +/- |
|---|---|---|---|
| Jan | 0.02 | 0.04 | 0.02 |
| Feb | 0.02 | 0.13 | 0.11 |
| Mar | 0.08 | 0.21 | 0.13 |
| Apr | 0.52 | 0.46 | -0.06 |
| May | 1.25 | 1.73 | 0.48 |
| Jun | 1.54 | 1.44 | -0.10 |
| Jul | 0.50 | 1.73 | 1.24 |
| Aug | 1.00 | 2.13 | 1.13 |
| Sep | 1.26 | 2.12 | 0.86 |
| Oct | 0.94 | 1.12 | 0.18 |
| Nov | 0.35 | 0.24 | -0.11 |
| Dec | 0.04 | 0.03 | -0.01 |
| ⌀ Month | 0.63 | 0.95 | 0.32 |
Snow (mm)
| Month | ⌀ 1940 - 1950 | ⌀ 2013 - 2023 | +/- |
|---|---|---|---|
| Jan | 1.40 | 1.84 | 0.44 |
| Feb | 1.65 | 1.67 | 0.03 |
| Mar | 1.67 | 1.52 | -0.14 |
| Apr | 1.14 | 1.17 | 0.04 |
| May | 0.47 | 0.45 | -0.02 |
| Jun | 0.10 | 0.06 | -0.04 |
| Jul | 0.00 | 0.00 | 0.00 |
| Aug | 0.00 | 0.00 | 0.00 |
| Sep | 0.04 | 0.13 | 0.09 |
| Oct | 0.64 | 0.46 | -0.18 |
| Nov | 1.45 | 1.23 | -0.22 |
| Dec | 1.77 | 1.79 | 0.01 |
| ⌀ Month | 0.86 | 0.86 | 0.00 |