Climate Change Chart of Sierra Nevada, Spain
Comprehensive Climate Change Chart of Sierra Nevada, Spain: Monthly Averages and Impact Trends
Discover how climate change is impacting Sierra Nevada, Spain, through insightful data analysis.
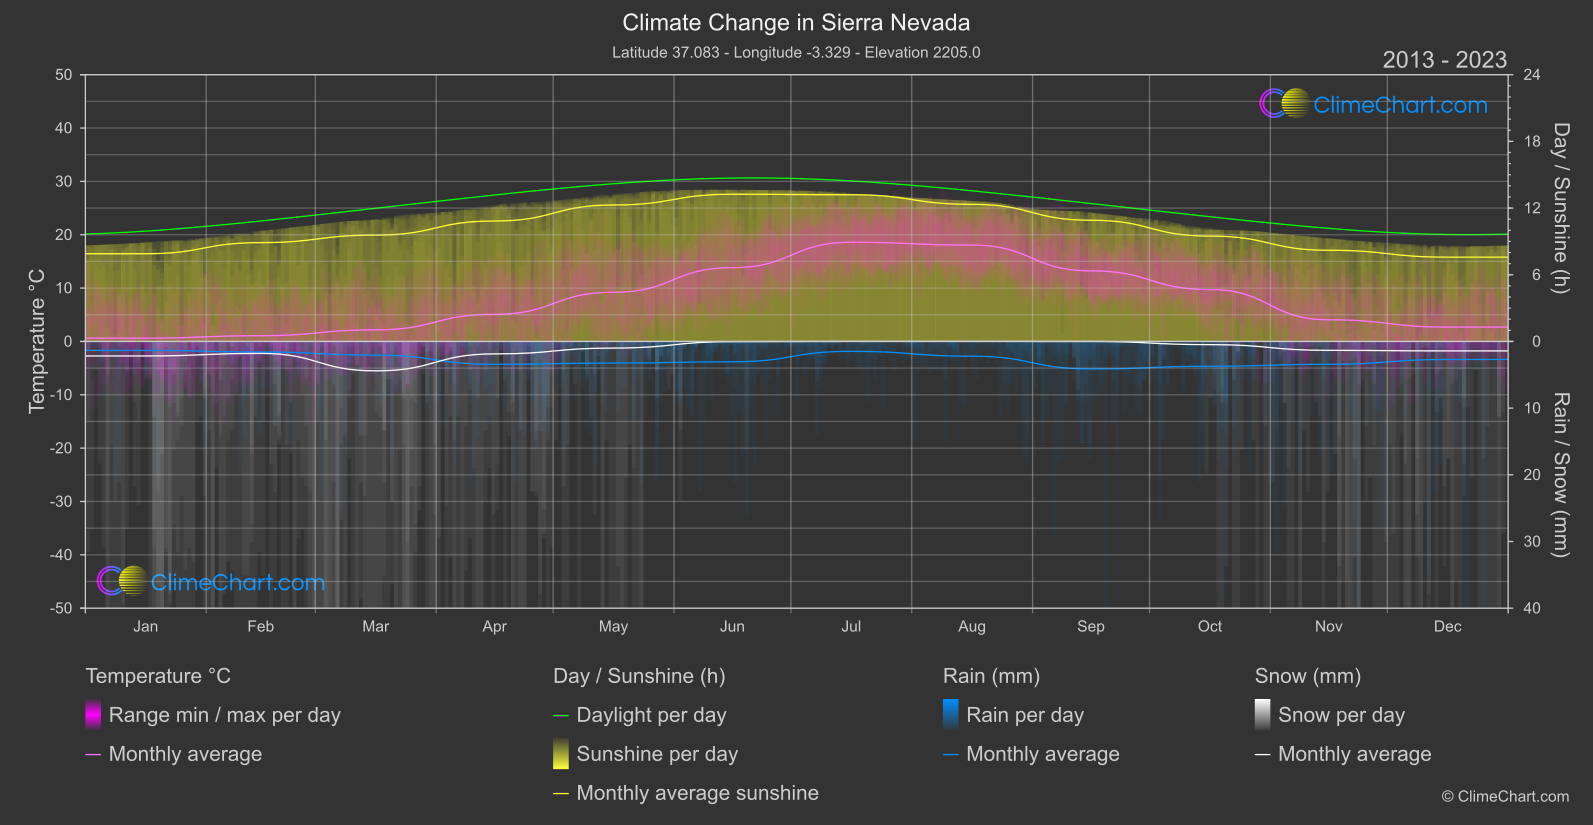
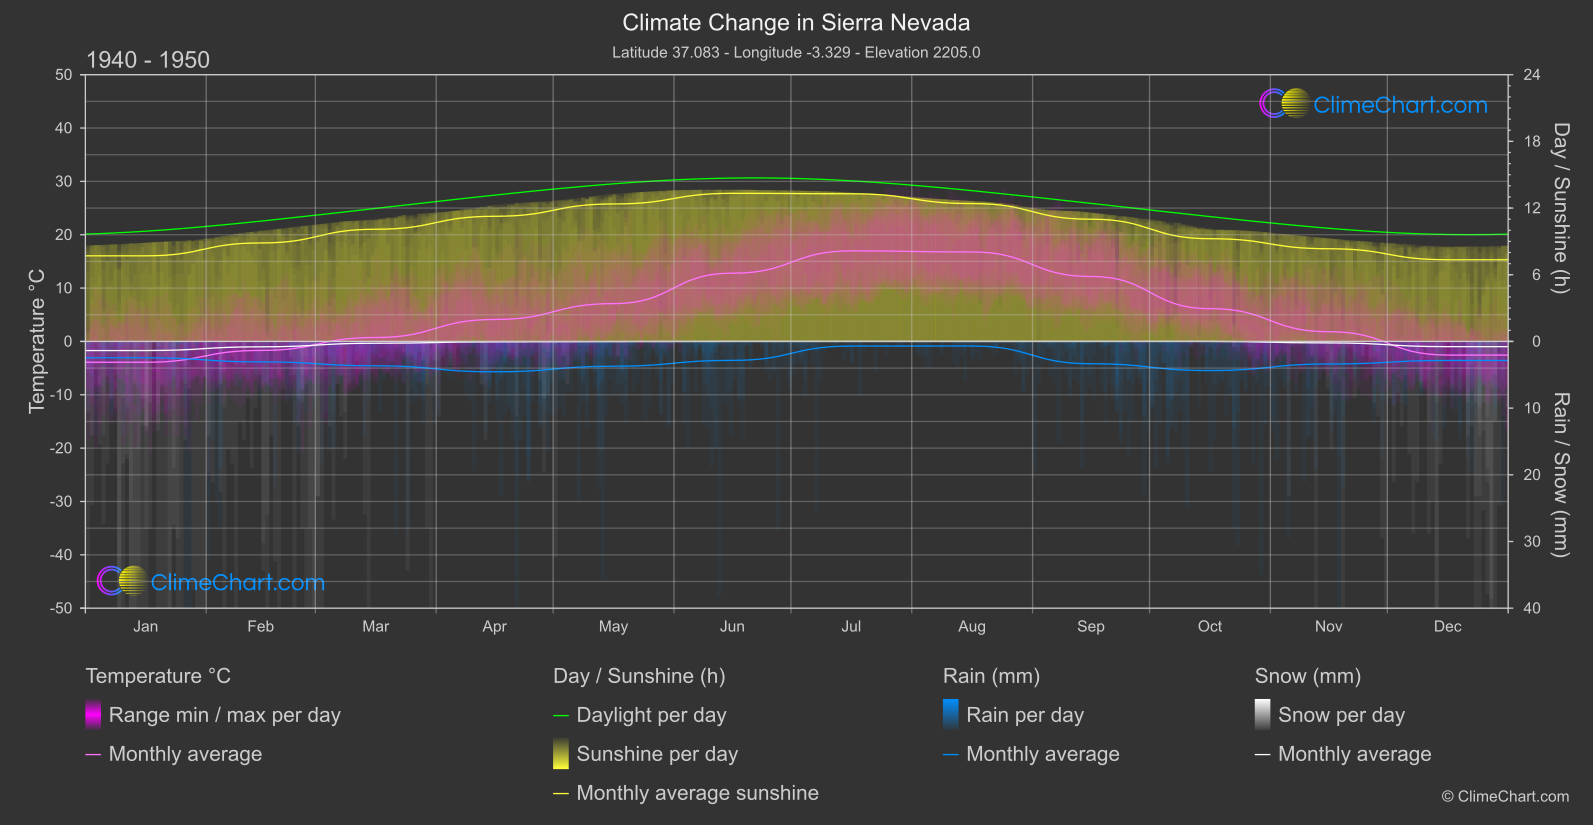
Sierra Nevada, located in Spain, has experienced significant changes in temperature, rainfall, snowfall, and sunshine duration over the years. Analyzing the data from 1940 - 1950 and comparing it to 2013 - 2024 reveals interesting insights. For instance, October shows a substantial increase in temperature, while March exhibits a remarkable rise in snowfall. The data also indicates fluctuations in rainfall and sunshine duration throughout the year, highlighting the impact of climate change on this region.
Climate Change Data Overview for Sierra Nevada, Spain
Explore the comprehensive climate change data for Sierra Nevada, Spain. This detailed table provides valuable insights into temperature variations, precipitation levels, and seasonal changes influenced by climate change, helping you understand the unique weather patterns of this region.
Temperature °C
| Month | ⌀ 1940 - 1950 | ⌀ 2013 - 2023 | +/- |
|---|---|---|---|
| Jan | -3.90 | 0.61 | 4.52 |
| Feb | -1.69 | 1.08 | 2.76 |
| Mar | 0.74 | 2.17 | 1.44 |
| Apr | 4.11 | 5.08 | 0.97 |
| May | 7.09 | 9.21 | 2.12 |
| Jun | 12.79 | 13.84 | 1.05 |
| Jul | 16.98 | 18.59 | 1.61 |
| Aug | 16.77 | 18.06 | 1.29 |
| Sep | 12.17 | 13.23 | 1.06 |
| Oct | 6.15 | 9.72 | 3.57 |
| Nov | 1.82 | 4.06 | 2.23 |
| Dec | -2.55 | 2.69 | 5.24 |
| ⌀ Month | 5.87 | 8.19 | 2.32 |
Sunshine (h)
| Month | ⌀ 1940 - 1950 | ⌀ 2013 - 2023 | +/- |
|---|---|---|---|
| Jan | 7.70 | 7.89 | 0.19 |
| Feb | 8.86 | 8.89 | 0.03 |
| Mar | 10.09 | 9.57 | -0.52 |
| Apr | 11.26 | 10.84 | -0.42 |
| May | 12.37 | 12.27 | -0.09 |
| Jun | 13.32 | 13.24 | -0.08 |
| Jul | 13.28 | 13.20 | -0.09 |
| Aug | 12.40 | 12.33 | -0.07 |
| Sep | 11.00 | 10.90 | -0.09 |
| Oct | 9.24 | 9.48 | 0.23 |
| Nov | 8.34 | 8.20 | -0.14 |
| Dec | 7.35 | 7.58 | 0.23 |
| ⌀ Month | 10.44 | 10.37 | -0.07 |
Rain (mm)
| Month | ⌀ 1940 - 1950 | ⌀ 2013 - 2023 | +/- |
|---|---|---|---|
| Jan | 1.22 | 0.67 | -0.55 |
| Feb | 1.53 | 0.79 | -0.74 |
| Mar | 1.83 | 1.03 | -0.80 |
| Apr | 2.28 | 1.72 | -0.56 |
| May | 1.86 | 1.62 | -0.24 |
| Jun | 1.42 | 1.53 | 0.11 |
| Jul | 0.35 | 0.74 | 0.39 |
| Aug | 0.35 | 1.11 | 0.76 |
| Sep | 1.67 | 2.06 | 0.39 |
| Oct | 2.18 | 1.86 | -0.32 |
| Nov | 1.69 | 1.72 | 0.02 |
| Dec | 1.43 | 1.35 | -0.08 |
| ⌀ Month | 1.48 | 1.35 | -0.14 |
Snow (mm)
| Month | ⌀ 1940 - 1950 | ⌀ 2013 - 2023 | +/- |
|---|---|---|---|
| Jan | 0.68 | 1.09 | 0.41 |
| Feb | 0.40 | 0.90 | 0.49 |
| Mar | 0.13 | 2.21 | 2.07 |
| Apr | 0.03 | 0.93 | 0.90 |
| May | 0.01 | 0.50 | 0.49 |
| Jun | 0.00 | 0.02 | 0.02 |
| Jul | 0.00 | 0.00 | 0.00 |
| Aug | 0.00 | 0.00 | 0.00 |
| Sep | 0.00 | 0.00 | 0.00 |
| Oct | 0.00 | 0.24 | 0.24 |
| Nov | 0.11 | 0.67 | 0.56 |
| Dec | 0.39 | 0.71 | 0.32 |
| ⌀ Month | 0.15 | 0.61 | 0.46 |