Climate Change Chart of Sicily, Italy
Comprehensive Climate Change Chart of Sicily, Italy: Monthly Averages and Impact Trends
Explore the changing climate in Sicily, Italy through insightful data analysis. Discover the impacts of climate change on temperature, rainfall, snowfall, and sunshine duration over the years.
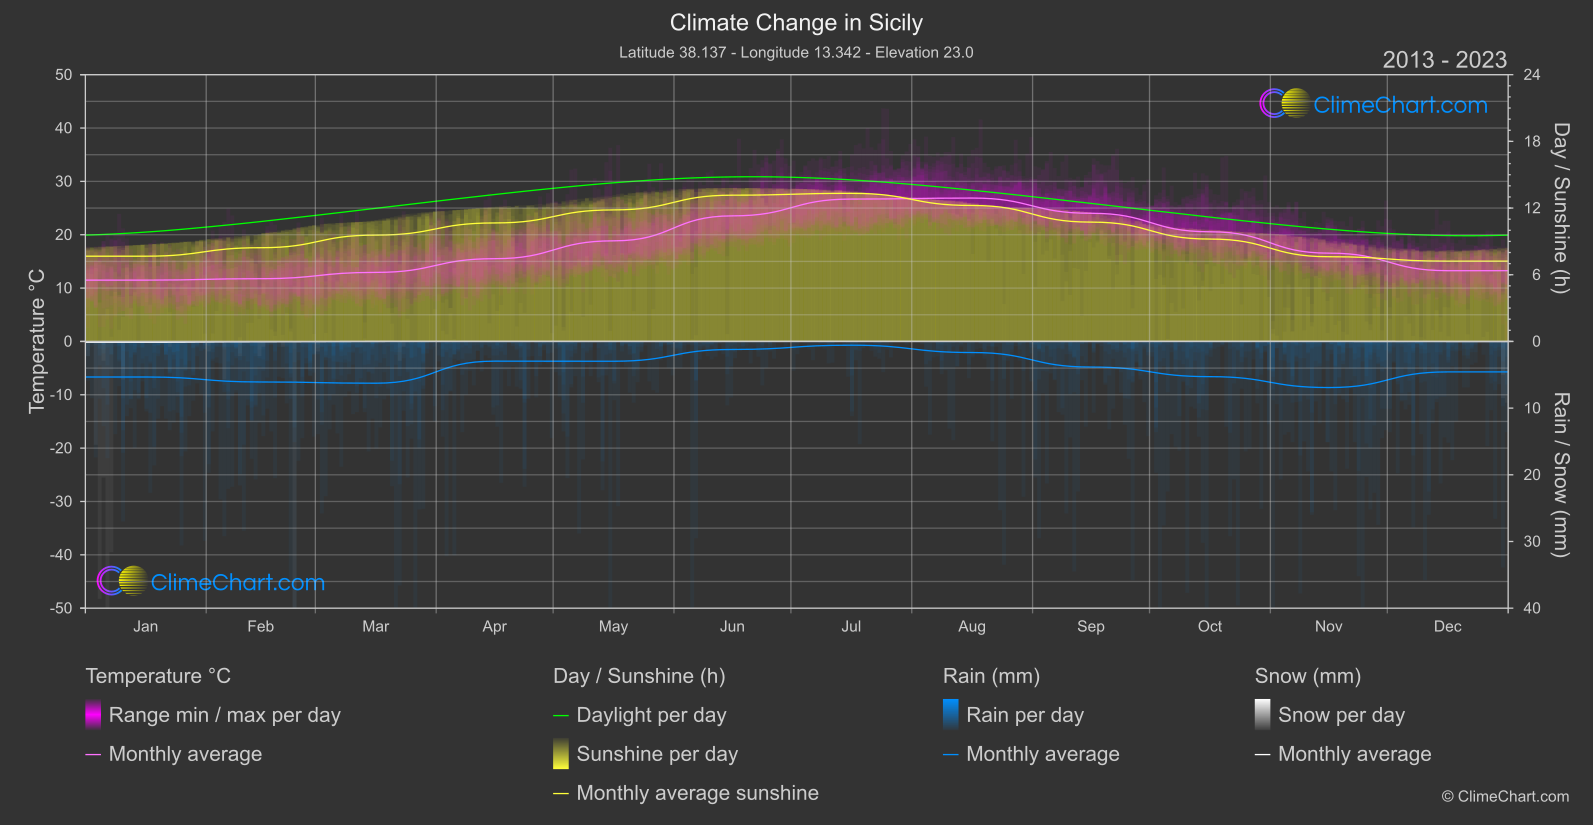
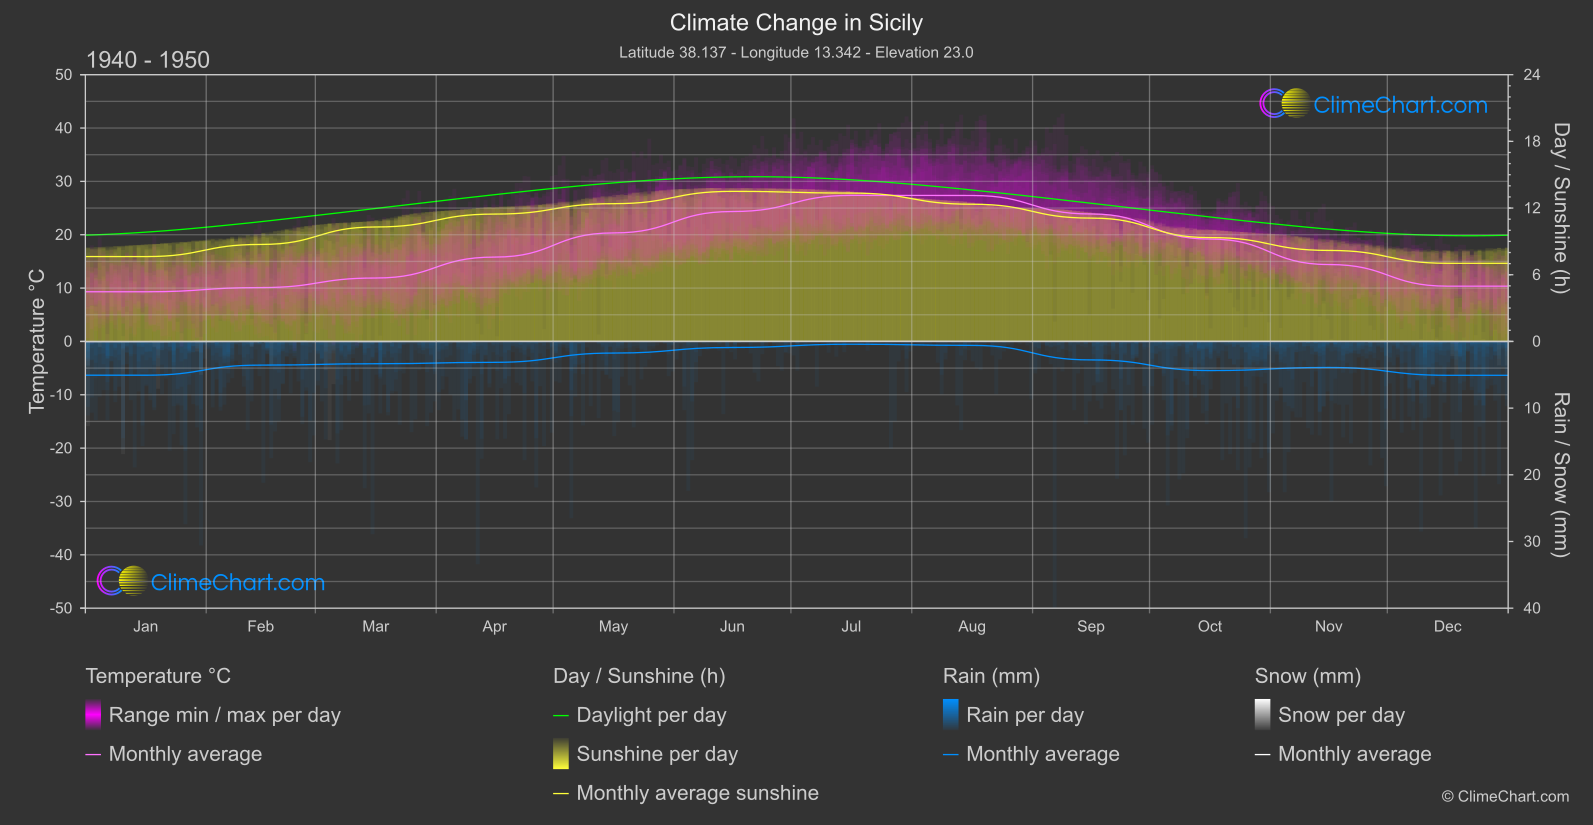
Sicily, Italy experiences varying climate patterns with notable changes in temperature, rainfall, snowfall, and sunshine duration compared between the years 1940 - 1950 and 2013 - 2024. The data reveals that the month with the highest temperature change is December, showing an increase of 2.903°C. In terms of rainfall, November exhibits the most significant change with an increase of 1.506 mm. Snowfall remains minimal throughout the years, with January showing the highest change of 0.046 mm. Sunshine hours fluctuate, with March experiencing the most significant decrease of 0.730 hours. These insights highlight the evolving climate trends in Sicily, emphasizing the impact of climate change over the decades.
Climate Change Data Overview for Sicily, Italy
Explore the comprehensive climate change data for Sicily, Italy. This detailed table provides valuable insights into temperature variations, precipitation levels, and seasonal changes influenced by climate change, helping you understand the unique weather patterns of this region.
Temperature °C
| Month | ⌀ 1940 - 1950 | ⌀ 2013 - 2023 | +/- |
|---|---|---|---|
| Jan | 9.31 | 11.49 | 2.18 |
| Feb | 10.10 | 11.76 | 1.66 |
| Mar | 11.89 | 12.94 | 1.05 |
| Apr | 15.81 | 15.51 | -0.30 |
| May | 20.34 | 18.86 | -1.48 |
| Jun | 24.35 | 23.54 | -0.81 |
| Jul | 27.38 | 26.68 | -0.70 |
| Aug | 27.36 | 26.87 | -0.48 |
| Sep | 23.89 | 24.02 | 0.13 |
| Oct | 19.19 | 20.55 | 1.36 |
| Nov | 14.42 | 16.55 | 2.13 |
| Dec | 10.36 | 13.26 | 2.90 |
| ⌀ Month | 17.87 | 18.50 | 0.64 |
Sunshine (h)
| Month | ⌀ 1940 - 1950 | ⌀ 2013 - 2023 | +/- |
|---|---|---|---|
| Jan | 7.63 | 7.67 | 0.04 |
| Feb | 8.73 | 8.43 | -0.29 |
| Mar | 10.30 | 9.57 | -0.73 |
| Apr | 11.46 | 10.66 | -0.80 |
| May | 12.39 | 11.83 | -0.56 |
| Jun | 13.50 | 13.16 | -0.34 |
| Jul | 13.35 | 13.32 | -0.02 |
| Aug | 12.34 | 12.23 | -0.11 |
| Sep | 11.10 | 10.74 | -0.36 |
| Oct | 9.34 | 9.21 | -0.13 |
| Nov | 8.19 | 7.62 | -0.57 |
| Dec | 7.03 | 7.22 | 0.19 |
| ⌀ Month | 10.45 | 10.14 | -0.31 |
Rain (mm)
| Month | ⌀ 1940 - 1950 | ⌀ 2013 - 2023 | +/- |
|---|---|---|---|
| Jan | 2.53 | 2.67 | 0.13 |
| Feb | 1.78 | 3.04 | 1.26 |
| Mar | 1.67 | 3.13 | 1.46 |
| Apr | 1.57 | 1.48 | -0.09 |
| May | 0.87 | 1.49 | 0.61 |
| Jun | 0.45 | 0.60 | 0.15 |
| Jul | 0.21 | 0.28 | 0.07 |
| Aug | 0.30 | 0.83 | 0.53 |
| Sep | 1.39 | 1.92 | 0.54 |
| Oct | 2.18 | 2.64 | 0.46 |
| Nov | 1.95 | 3.46 | 1.51 |
| Dec | 2.54 | 2.28 | -0.25 |
| ⌀ Month | 1.45 | 1.99 | 0.53 |
Snow (mm)
| Month | ⌀ 1940 - 1950 | ⌀ 2013 - 2023 | +/- |
|---|---|---|---|
| Jan | 0.01 | 0.06 | 0.05 |
| Feb | 0.00 | 0.02 | 0.02 |
| Mar | 0.01 | 0.00 | -0.01 |
| Apr | 0.00 | 0.00 | 0.00 |
| May | 0.00 | 0.00 | 0.00 |
| Jun | 0.00 | 0.00 | 0.00 |
| Jul | 0.00 | 0.00 | 0.00 |
| Aug | 0.00 | 0.00 | 0.00 |
| Sep | 0.00 | 0.00 | 0.00 |
| Oct | 0.00 | 0.00 | 0.00 |
| Nov | 0.00 | 0.00 | 0.00 |
| Dec | 0.00 | 0.01 | 0.00 |
| ⌀ Month | 0.00 | 0.01 | 0.01 |