Climate Change Chart of Shenyang, China
Comprehensive Climate Change Chart of Shenyang, China: Monthly Averages and Impact Trends
Explore the changing climate patterns in Shenyang, China through insightful data analysis.
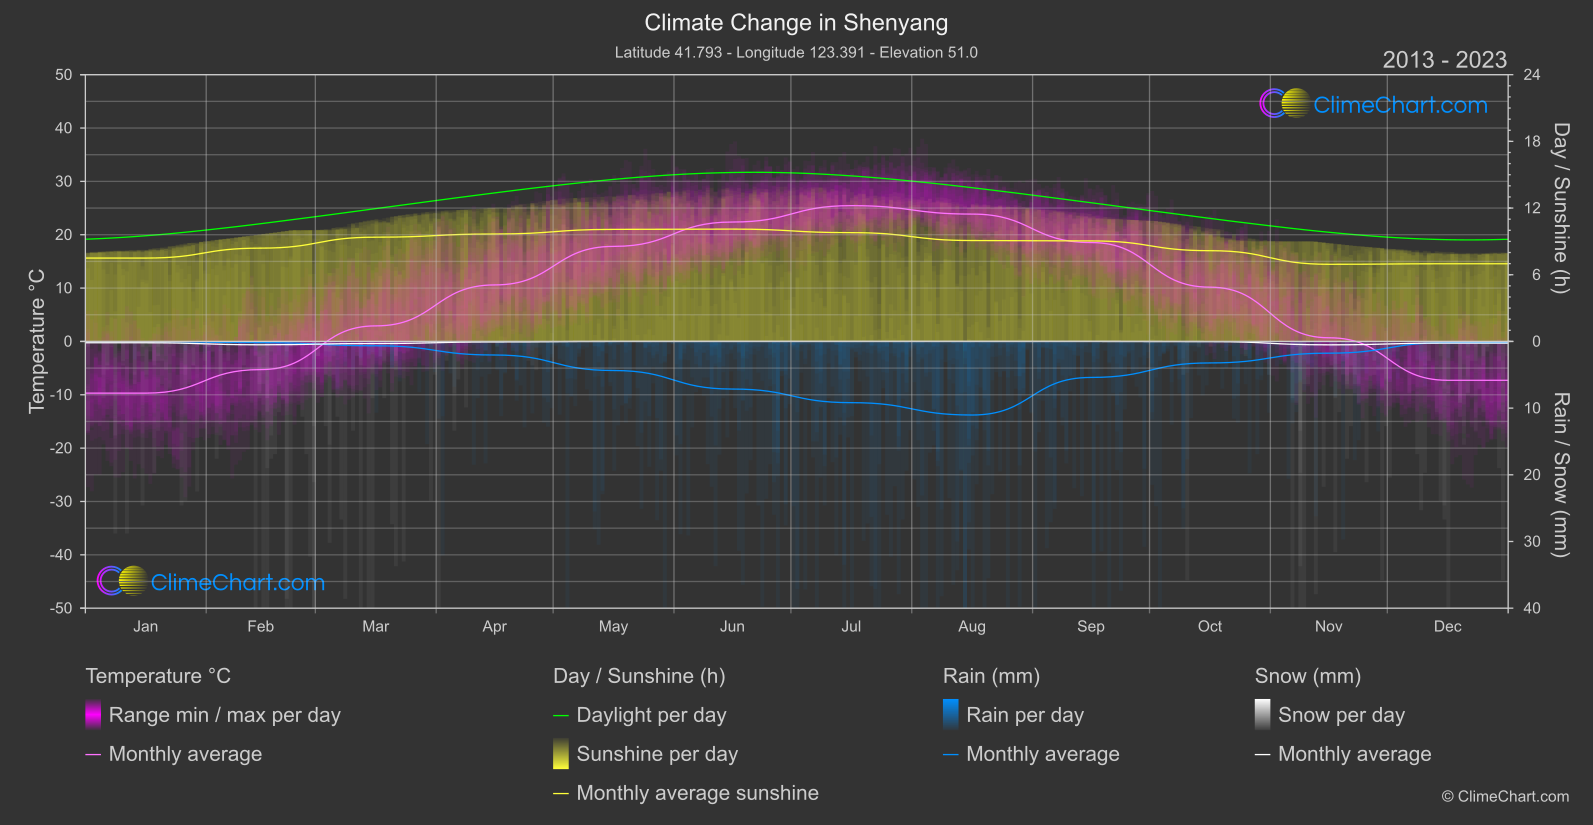
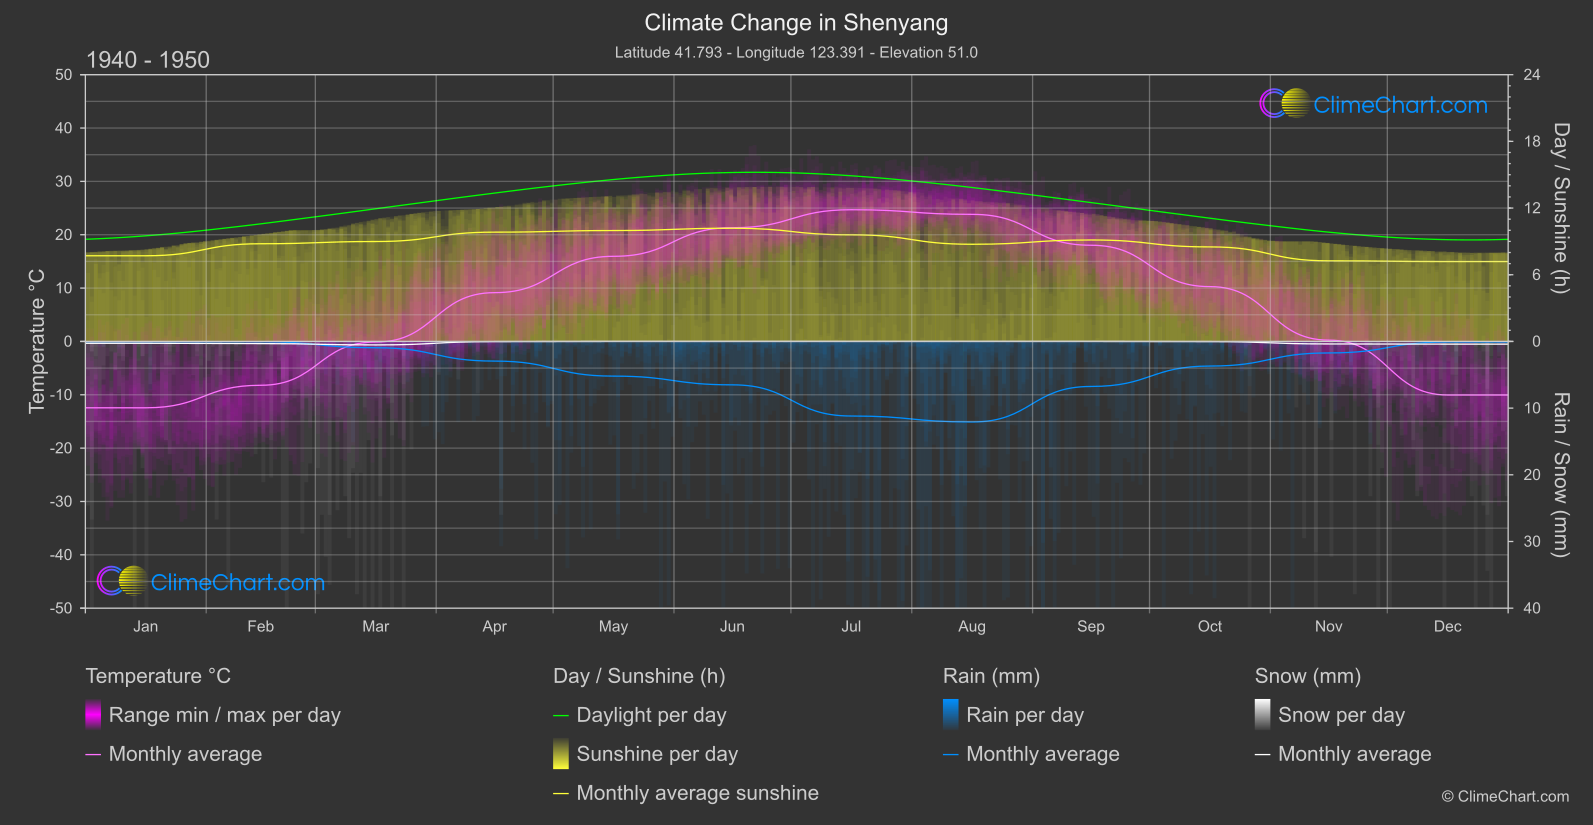
Shenyang, a city in northeastern China, has experienced notable changes in temperature, rainfall, snowfall, and sunshine duration over the years. Analyzing the data reveals interesting insights such as the month with the highest temperature change or rainfall fluctuation. Climate change in Shenyang is evident through these data points, indicating the need for sustainable environmental practices and adaptation strategies.
Climate Change Data Overview for Shenyang, China
Explore the comprehensive climate change data for Shenyang, China. This detailed table provides valuable insights into temperature variations, precipitation levels, and seasonal changes influenced by climate change, helping you understand the unique weather patterns of this region.
Temperature °C
| Month | ⌀ 1940 - 1950 | ⌀ 2013 - 2023 | +/- |
|---|---|---|---|
| Jan | -12.44 | -9.69 | 2.75 |
| Feb | -8.22 | -5.28 | 2.94 |
| Mar | -0.11 | 2.92 | 3.03 |
| Apr | 9.14 | 10.59 | 1.45 |
| May | 15.96 | 17.81 | 1.86 |
| Jun | 21.31 | 22.38 | 1.07 |
| Jul | 24.69 | 25.45 | 0.76 |
| Aug | 23.82 | 23.87 | 0.05 |
| Sep | 18.03 | 18.54 | 0.51 |
| Oct | 10.28 | 10.17 | -0.10 |
| Nov | 0.24 | 0.69 | 0.44 |
| Dec | -10.04 | -7.28 | 2.76 |
| ⌀ Month | 7.72 | 9.18 | 1.46 |
Sunshine (h)
| Month | ⌀ 1940 - 1950 | ⌀ 2013 - 2023 | +/- |
|---|---|---|---|
| Jan | 7.71 | 7.50 | -0.21 |
| Feb | 8.79 | 8.39 | -0.39 |
| Mar | 8.99 | 9.38 | 0.39 |
| Apr | 9.83 | 9.67 | -0.17 |
| May | 9.98 | 10.08 | 0.10 |
| Jun | 10.18 | 10.11 | -0.08 |
| Jul | 9.59 | 9.79 | 0.20 |
| Aug | 8.74 | 9.08 | 0.34 |
| Sep | 9.13 | 9.04 | -0.08 |
| Oct | 8.50 | 8.16 | -0.34 |
| Nov | 7.25 | 6.94 | -0.31 |
| Dec | 7.18 | 6.99 | -0.20 |
| ⌀ Month | 8.82 | 8.76 | -0.06 |
Rain (mm)
| Month | ⌀ 1940 - 1950 | ⌀ 2013 - 2023 | +/- |
|---|---|---|---|
| Jan | 0.03 | 0.02 | -0.01 |
| Feb | 0.02 | 0.09 | 0.07 |
| Mar | 0.47 | 0.33 | -0.15 |
| Apr | 1.47 | 1.02 | -0.46 |
| May | 2.60 | 2.18 | -0.42 |
| Jun | 3.26 | 3.57 | 0.32 |
| Jul | 5.59 | 4.59 | -1.00 |
| Aug | 6.04 | 5.52 | -0.52 |
| Sep | 3.38 | 2.70 | -0.68 |
| Oct | 1.85 | 1.61 | -0.23 |
| Nov | 0.86 | 0.88 | 0.02 |
| Dec | 0.04 | 0.09 | 0.05 |
| ⌀ Month | 2.13 | 1.88 | -0.25 |
Snow (mm)
| Month | ⌀ 1940 - 1950 | ⌀ 2013 - 2023 | +/- |
|---|---|---|---|
| Jan | 0.14 | 0.10 | -0.04 |
| Feb | 0.16 | 0.25 | 0.09 |
| Mar | 0.26 | 0.16 | -0.11 |
| Apr | 0.01 | 0.04 | 0.02 |
| May | 0.00 | 0.00 | 0.00 |
| Jun | 0.00 | 0.00 | 0.00 |
| Jul | 0.00 | 0.00 | 0.00 |
| Aug | 0.00 | 0.00 | 0.00 |
| Sep | 0.00 | 0.00 | 0.00 |
| Oct | 0.01 | 0.01 | 0.00 |
| Nov | 0.19 | 0.25 | 0.07 |
| Dec | 0.20 | 0.12 | -0.08 |
| ⌀ Month | 0.08 | 0.08 | -0.00 |