Climate Change Chart of Sharm el-Sheikh, Egypt
Comprehensive Climate Change Chart of Sharm el-Sheikh, Egypt: Monthly Averages and Impact Trends
Explore the changing climate in Sharm el-Sheikh, Egypt with insights from temperature, rainfall, and sunshine duration data.
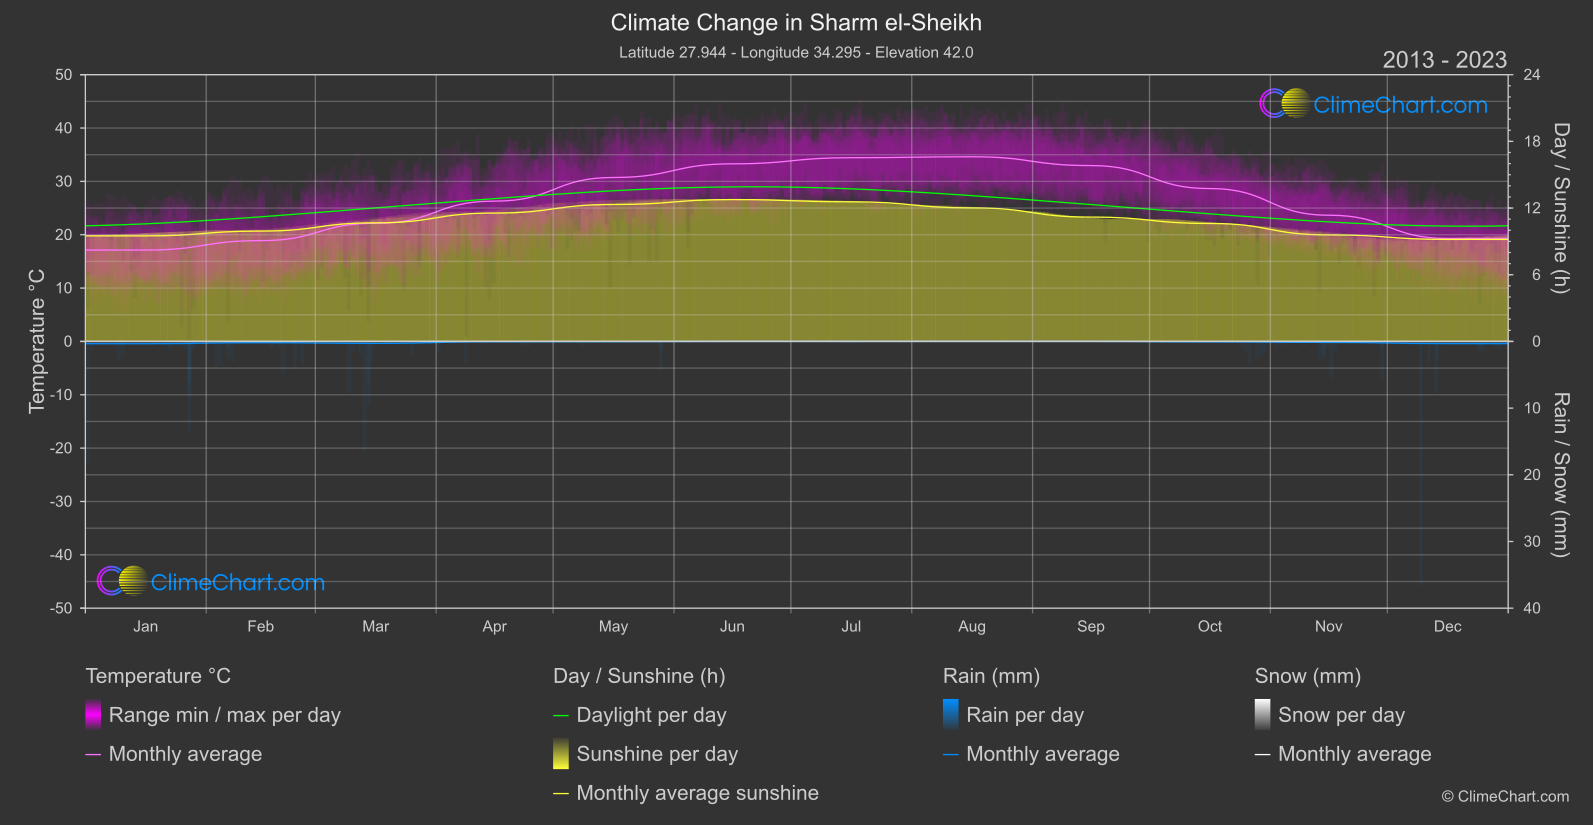
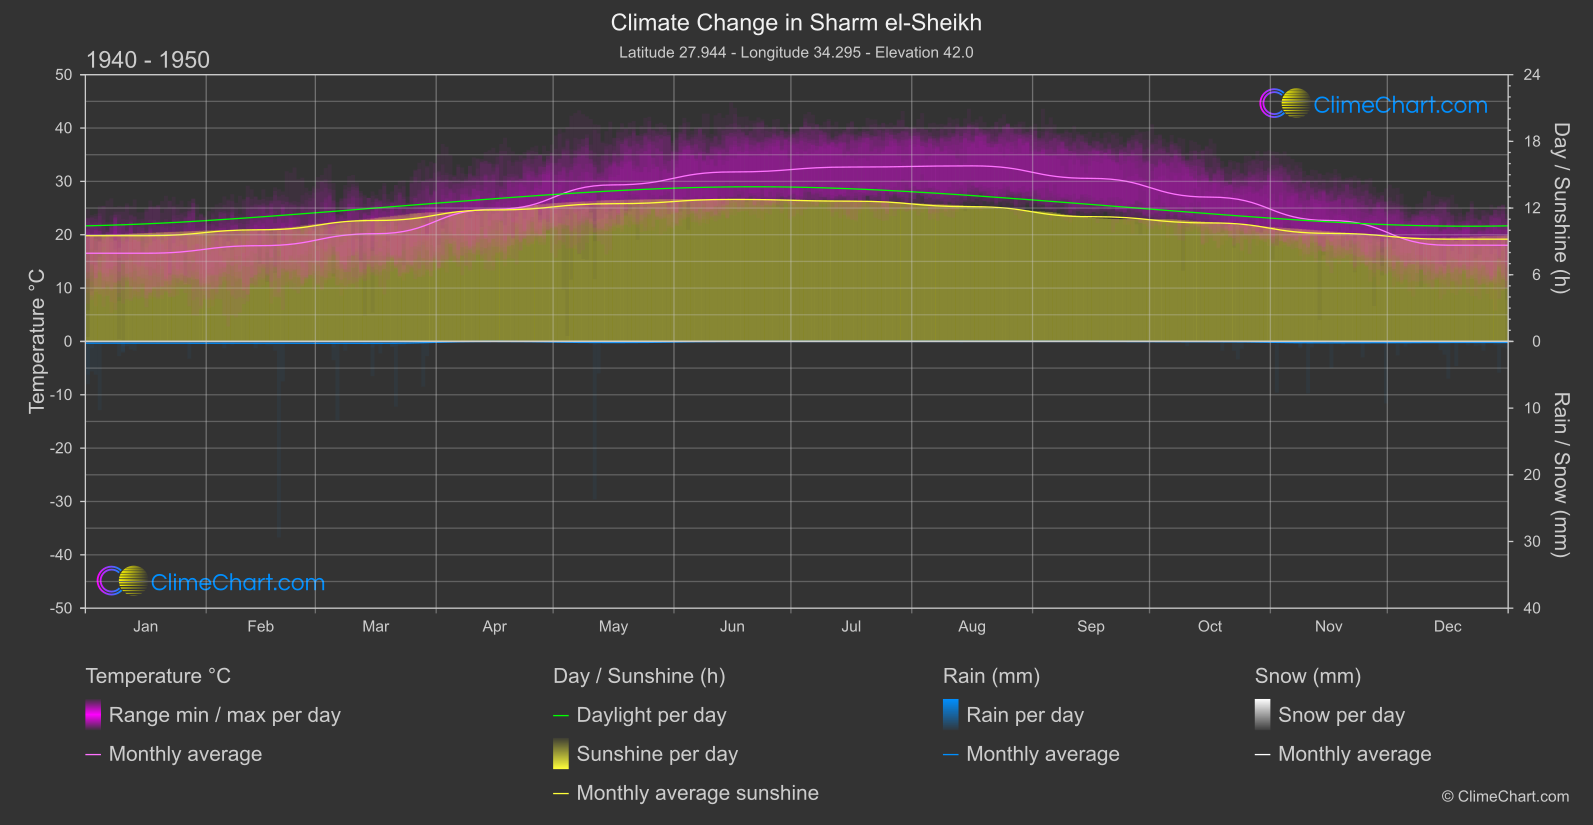
Sharm el-Sheikh, Egypt, experiences notable changes in temperature, rainfall, and sunshine duration over the years. The data from 1940-1950 compared to 2013-2024 shows an increase in temperatures across most months, with September having the highest temperature change. Rainfall patterns vary, with some months showing a decrease in rainfall like February, while others, such as December, see an increase. Sunshine duration also fluctuates, with March having the most significant decrease in sunshine hours.
Climate Change Data Overview for Sharm el-Sheikh, Egypt
Explore the comprehensive climate change data for Sharm el-Sheikh, Egypt. This detailed table provides valuable insights into temperature variations, precipitation levels, and seasonal changes influenced by climate change, helping you understand the unique weather patterns of this region.
Temperature °C
| Month | ⌀ 1940 - 1950 | ⌀ 2013 - 2023 | +/- |
|---|---|---|---|
| Jan | 16.53 | 17.13 | 0.60 |
| Feb | 17.95 | 18.89 | 0.94 |
| Mar | 20.19 | 22.15 | 1.95 |
| Apr | 24.77 | 26.30 | 1.52 |
| May | 29.34 | 30.73 | 1.39 |
| Jun | 31.77 | 33.29 | 1.52 |
| Jul | 32.69 | 34.44 | 1.75 |
| Aug | 32.91 | 34.61 | 1.70 |
| Sep | 30.56 | 32.96 | 2.40 |
| Oct | 27.05 | 28.65 | 1.60 |
| Nov | 22.67 | 23.66 | 0.99 |
| Dec | 18.03 | 19.30 | 1.27 |
| ⌀ Month | 25.37 | 26.84 | 1.47 |
Sunshine (h)
| Month | ⌀ 1940 - 1950 | ⌀ 2013 - 2023 | +/- |
|---|---|---|---|
| Jan | 9.51 | 9.50 | -0.01 |
| Feb | 10.05 | 9.93 | -0.12 |
| Mar | 10.88 | 10.67 | -0.21 |
| Apr | 11.83 | 11.55 | -0.28 |
| May | 12.39 | 12.32 | -0.07 |
| Jun | 12.78 | 12.76 | -0.01 |
| Jul | 12.62 | 12.56 | -0.06 |
| Aug | 12.12 | 12.02 | -0.10 |
| Sep | 11.23 | 11.19 | -0.04 |
| Oct | 10.66 | 10.61 | -0.05 |
| Nov | 9.73 | 9.58 | -0.14 |
| Dec | 9.20 | 9.18 | -0.02 |
| ⌀ Month | 11.08 | 10.99 | -0.09 |
Rain (mm)
| Month | ⌀ 1940 - 1950 | ⌀ 2013 - 2023 | +/- |
|---|---|---|---|
| Jan | 0.13 | 0.17 | 0.04 |
| Feb | 0.13 | 0.09 | -0.04 |
| Mar | 0.14 | 0.15 | 0.01 |
| Apr | 0.00 | 0.02 | 0.02 |
| May | 0.09 | 0.02 | -0.07 |
| Jun | 0.00 | 0.00 | 0.00 |
| Jul | 0.00 | 0.00 | 0.00 |
| Aug | 0.00 | 0.00 | -0.00 |
| Sep | 0.00 | 0.00 | 0.00 |
| Oct | 0.02 | 0.03 | 0.01 |
| Nov | 0.10 | 0.07 | -0.03 |
| Dec | 0.08 | 0.16 | 0.08 |
| ⌀ Month | 0.06 | 0.06 | 0.00 |
Snow (mm)
| Month | ⌀ 1940 - 1950 | ⌀ 2013 - 2023 | +/- |
|---|---|---|---|
| Jan | 0.00 | 0.00 | 0.00 |
| Feb | 0.00 | 0.00 | 0.00 |
| Mar | 0.00 | 0.00 | 0.00 |
| Apr | 0.00 | 0.00 | 0.00 |
| May | 0.00 | 0.00 | 0.00 |
| Jun | 0.00 | 0.00 | 0.00 |
| Jul | 0.00 | 0.00 | 0.00 |
| Aug | 0.00 | 0.00 | 0.00 |
| Sep | 0.00 | 0.00 | 0.00 |
| Oct | 0.00 | 0.00 | 0.00 |
| Nov | 0.00 | 0.00 | 0.00 |
| Dec | 0.00 | 0.00 | 0.00 |
| ⌀ Month | 0.00 | 0.00 | 0.00 |