Climate Change Chart of Serre Chevalier, France
Comprehensive Climate Change Chart of Serre Chevalier, France: Monthly Averages and Impact Trends
Discover the changing climate in Serre Chevalier, France, through insightful data analysis.
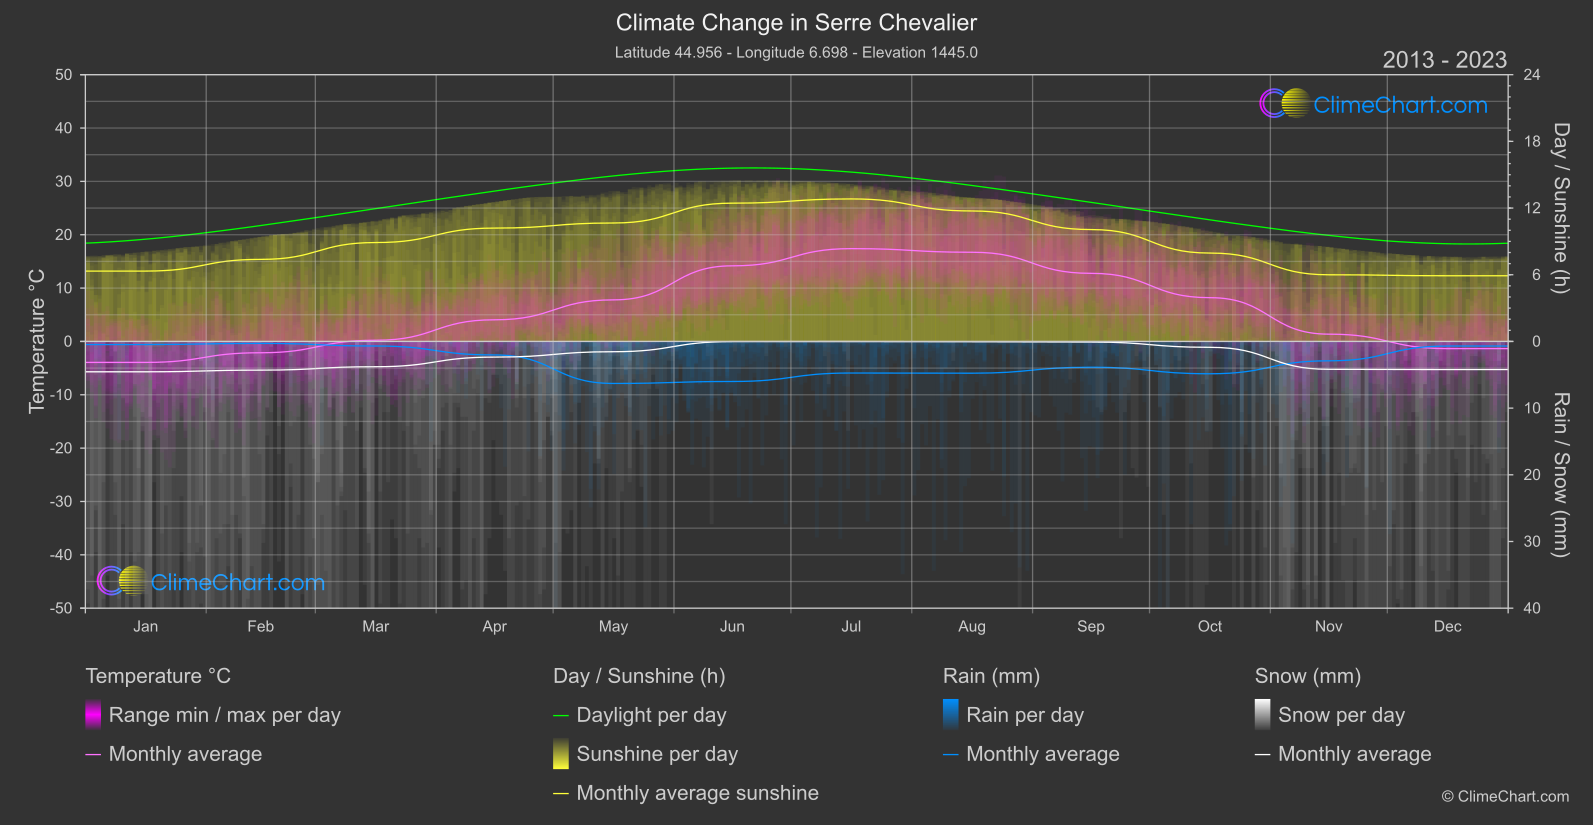
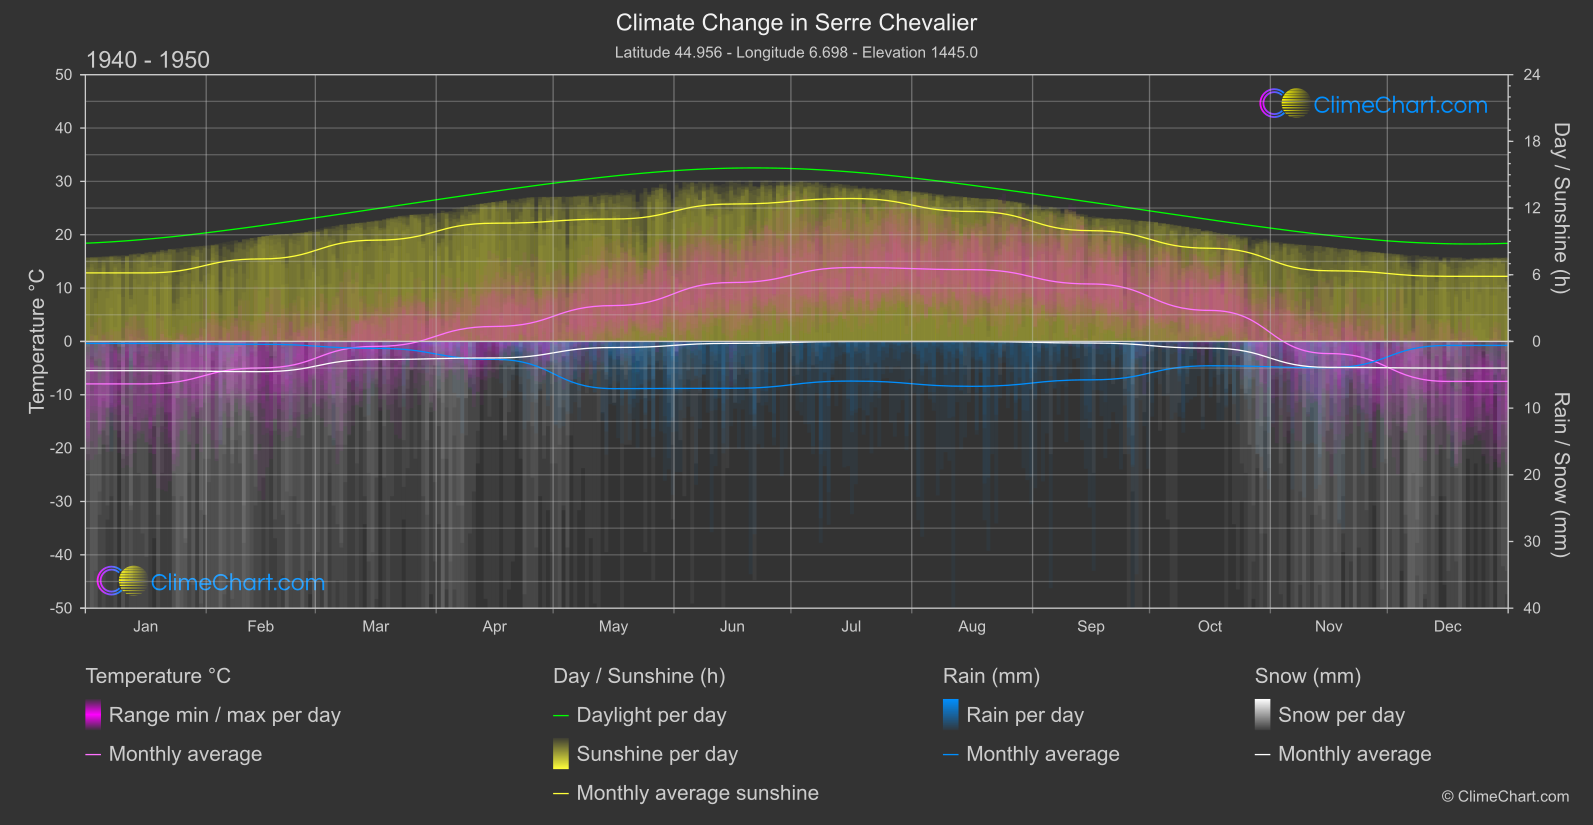
Serre Chevalier, France, has experienced significant changes in temperature, rainfall, snowfall, and sunshine duration over the years. From the data comparison between 1940 - 1950 and 2013 - 2024, we observe varying trends across different months. For instance, January shows a temperature increase of 4.03°C, while September sees a temperature rise of 1.99°C. In terms of rainfall, October experienced a notable increase of 0.60mm, whereas August had a decrease of 0.98mm. Snowfall patterns also fluctuated, with March showing a significant increase of 0.54mm, while October had a decrease of 0.06mm. Additionally, sunshine duration varied, with April experiencing a drop of 0.44 hours, while September saw an increase of 0.10 hours. These insights provide valuable information on the changing climate dynamics in Serre Chevalier, France.
Climate Change Data Overview for Serre Chevalier, France
Explore the comprehensive climate change data for Serre Chevalier, France. This detailed table provides valuable insights into temperature variations, precipitation levels, and seasonal changes influenced by climate change, helping you understand the unique weather patterns of this region.
Temperature °C
| Month | ⌀ 1940 - 1950 | ⌀ 2013 - 2023 | +/- |
|---|---|---|---|
| Jan | -7.96 | -3.93 | 4.03 |
| Feb | -4.97 | -2.12 | 2.85 |
| Mar | -0.93 | 0.22 | 1.15 |
| Apr | 2.81 | 4.06 | 1.25 |
| May | 6.72 | 7.79 | 1.07 |
| Jun | 11.04 | 14.17 | 3.13 |
| Jul | 13.85 | 17.39 | 3.54 |
| Aug | 13.46 | 16.71 | 3.26 |
| Sep | 10.77 | 12.76 | 1.99 |
| Oct | 5.82 | 8.20 | 2.39 |
| Nov | -2.28 | 1.36 | 3.64 |
| Dec | -7.49 | -1.35 | 6.15 |
| ⌀ Month | 3.40 | 6.27 | 2.87 |
Sunshine (h)
| Month | ⌀ 1940 - 1950 | ⌀ 2013 - 2023 | +/- |
|---|---|---|---|
| Jan | 6.17 | 6.33 | 0.16 |
| Feb | 7.42 | 7.38 | -0.04 |
| Mar | 9.11 | 8.90 | -0.22 |
| Apr | 10.64 | 10.20 | -0.44 |
| May | 11.01 | 10.66 | -0.36 |
| Jun | 12.36 | 12.44 | 0.08 |
| Jul | 12.86 | 12.82 | -0.04 |
| Aug | 11.69 | 11.74 | 0.05 |
| Sep | 9.97 | 10.07 | 0.10 |
| Oct | 8.38 | 7.95 | -0.43 |
| Nov | 6.36 | 6.00 | -0.36 |
| Dec | 5.86 | 5.91 | 0.05 |
| ⌀ Month | 9.32 | 9.20 | -0.12 |
Rain (mm)
| Month | ⌀ 1940 - 1950 | ⌀ 2013 - 2023 | +/- |
|---|---|---|---|
| Jan | 0.15 | 0.23 | 0.09 |
| Feb | 0.21 | 0.15 | -0.07 |
| Mar | 0.52 | 0.34 | -0.17 |
| Apr | 1.35 | 1.01 | -0.33 |
| May | 3.54 | 3.15 | -0.39 |
| Jun | 3.51 | 3.00 | -0.51 |
| Jul | 2.97 | 2.37 | -0.60 |
| Aug | 3.37 | 2.38 | -0.98 |
| Sep | 2.88 | 1.93 | -0.94 |
| Oct | 1.83 | 2.42 | 0.60 |
| Nov | 1.97 | 1.45 | -0.52 |
| Dec | 0.30 | 0.35 | 0.05 |
| ⌀ Month | 1.88 | 1.57 | -0.32 |
Snow (mm)
| Month | ⌀ 1940 - 1950 | ⌀ 2013 - 2023 | +/- |
|---|---|---|---|
| Jan | 2.19 | 2.28 | 0.08 |
| Feb | 2.26 | 2.15 | -0.11 |
| Mar | 1.35 | 1.90 | 0.54 |
| Apr | 1.24 | 1.17 | -0.06 |
| May | 0.46 | 0.77 | 0.31 |
| Jun | 0.14 | 0.01 | -0.13 |
| Jul | 0.00 | 0.01 | 0.00 |
| Aug | 0.01 | 0.02 | 0.02 |
| Sep | 0.12 | 0.05 | -0.07 |
| Oct | 0.51 | 0.44 | -0.06 |
| Nov | 1.95 | 2.09 | 0.14 |
| Dec | 2.00 | 2.11 | 0.11 |
| ⌀ Month | 1.02 | 1.08 | 0.06 |