Climate Change Chart of Sendai, Japan
Comprehensive Climate Change Chart of Sendai, Japan: Monthly Averages and Impact Trends
Exploring the changing climate patterns in Sendai, Japan reveals intriguing insights into the temperature, rainfall, snowfall, and sunshine duration. Dive into the data to uncover how the climate has evolved over the decades.
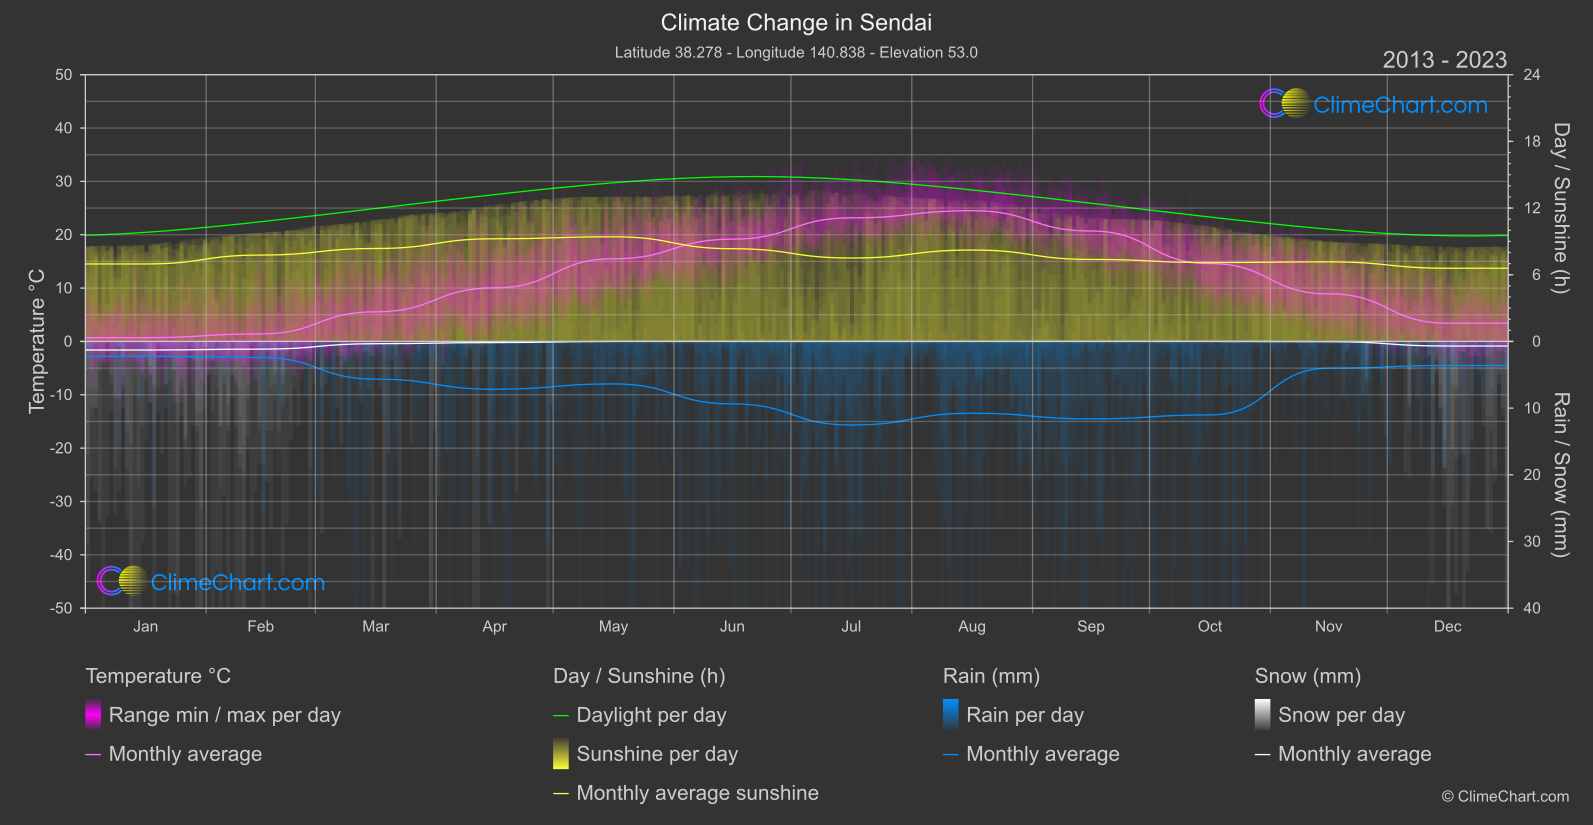
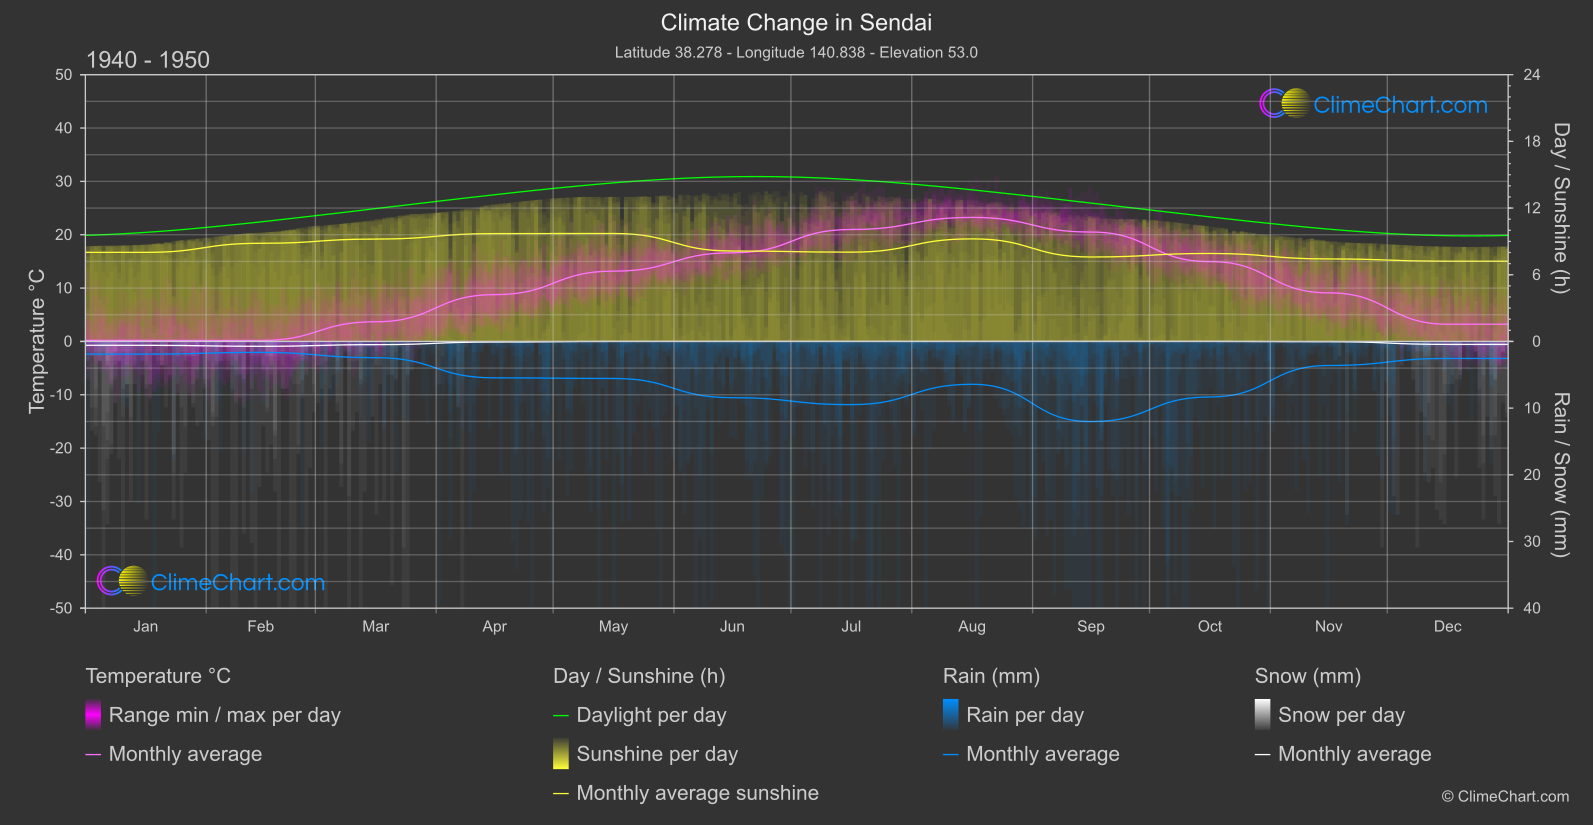
Sendai, Japan experiences varying climate conditions throughout the year. From the data provided, it is evident that temperatures have generally increased over the years, with significant changes observed in summer and spring months. Rainfall patterns also showcase fluctuations, with notable increments in March and July. Snowfall has seen a decline in most months, indicating a shift in winter precipitation trends. Additionally, sunshine duration exhibits fluctuations, with noticeable decreases in months like August and December. These insights highlight the dynamic nature of Sendai's climate and the impact of climate change on the region.
Climate Change Data Overview for Sendai, Japan
Explore the comprehensive climate change data for Sendai, Japan. This detailed table provides valuable insights into temperature variations, precipitation levels, and seasonal changes influenced by climate change, helping you understand the unique weather patterns of this region.
Temperature °C
| Month | ⌀ 1940 - 1950 | ⌀ 2013 - 2023 | +/- |
|---|---|---|---|
| Jan | 0.19 | 0.70 | 0.51 |
| Feb | 0.18 | 1.41 | 1.23 |
| Mar | 3.69 | 5.55 | 1.86 |
| Apr | 8.77 | 10.05 | 1.28 |
| May | 13.18 | 15.50 | 2.32 |
| Jun | 16.61 | 19.17 | 2.55 |
| Jul | 20.98 | 23.16 | 2.18 |
| Aug | 23.24 | 24.50 | 1.26 |
| Sep | 20.50 | 20.69 | 0.19 |
| Oct | 14.97 | 14.60 | -0.37 |
| Nov | 9.10 | 8.91 | -0.19 |
| Dec | 3.23 | 3.42 | 0.20 |
| ⌀ Month | 11.22 | 12.31 | 1.09 |
Sunshine (h)
| Month | ⌀ 1940 - 1950 | ⌀ 2013 - 2023 | +/- |
|---|---|---|---|
| Jan | 8.01 | 6.97 | -1.04 |
| Feb | 8.83 | 7.77 | -1.06 |
| Mar | 9.21 | 8.36 | -0.85 |
| Apr | 9.70 | 9.24 | -0.47 |
| May | 9.71 | 9.41 | -0.30 |
| Jun | 8.13 | 8.34 | 0.21 |
| Jul | 8.03 | 7.51 | -0.53 |
| Aug | 9.23 | 8.22 | -1.01 |
| Sep | 7.60 | 7.38 | -0.22 |
| Oct | 7.91 | 7.10 | -0.82 |
| Nov | 7.42 | 7.16 | -0.26 |
| Dec | 7.22 | 6.58 | -0.63 |
| ⌀ Month | 8.42 | 7.84 | -0.58 |
Rain (mm)
| Month | ⌀ 1940 - 1950 | ⌀ 2013 - 2023 | +/- |
|---|---|---|---|
| Jan | 0.95 | 1.11 | 0.16 |
| Feb | 0.82 | 1.20 | 0.38 |
| Mar | 1.22 | 2.83 | 1.61 |
| Apr | 2.73 | 3.58 | 0.85 |
| May | 2.78 | 3.18 | 0.41 |
| Jun | 4.22 | 4.68 | 0.47 |
| Jul | 4.74 | 6.26 | 1.53 |
| Aug | 3.21 | 5.38 | 2.17 |
| Sep | 6.01 | 5.81 | -0.20 |
| Oct | 4.16 | 5.51 | 1.35 |
| Nov | 1.80 | 2.00 | 0.20 |
| Dec | 1.28 | 1.80 | 0.53 |
| ⌀ Month | 2.83 | 3.61 | 0.79 |
Snow (mm)
| Month | ⌀ 1940 - 1950 | ⌀ 2013 - 2023 | +/- |
|---|---|---|---|
| Jan | 0.29 | 0.64 | 0.35 |
| Feb | 0.37 | 0.58 | 0.21 |
| Mar | 0.24 | 0.17 | -0.07 |
| Apr | 0.04 | 0.09 | 0.04 |
| May | 0.00 | 0.00 | 0.00 |
| Jun | 0.00 | 0.00 | 0.00 |
| Jul | 0.00 | 0.00 | 0.00 |
| Aug | 0.00 | 0.00 | 0.00 |
| Sep | 0.00 | 0.00 | 0.00 |
| Oct | 0.00 | 0.00 | 0.00 |
| Nov | 0.02 | 0.02 | -0.00 |
| Dec | 0.22 | 0.34 | 0.12 |
| ⌀ Month | 0.10 | 0.15 | 0.05 |