Climate Change Chart of Sardinia, Italy
Comprehensive Climate Change Chart of Sardinia, Italy: Monthly Averages and Impact Trends
Explore the changing climate in Sardinia, Italy, through insightful data analysis. Discover the trends in temperature, rainfall, snowfall, and sunshine duration over the years.
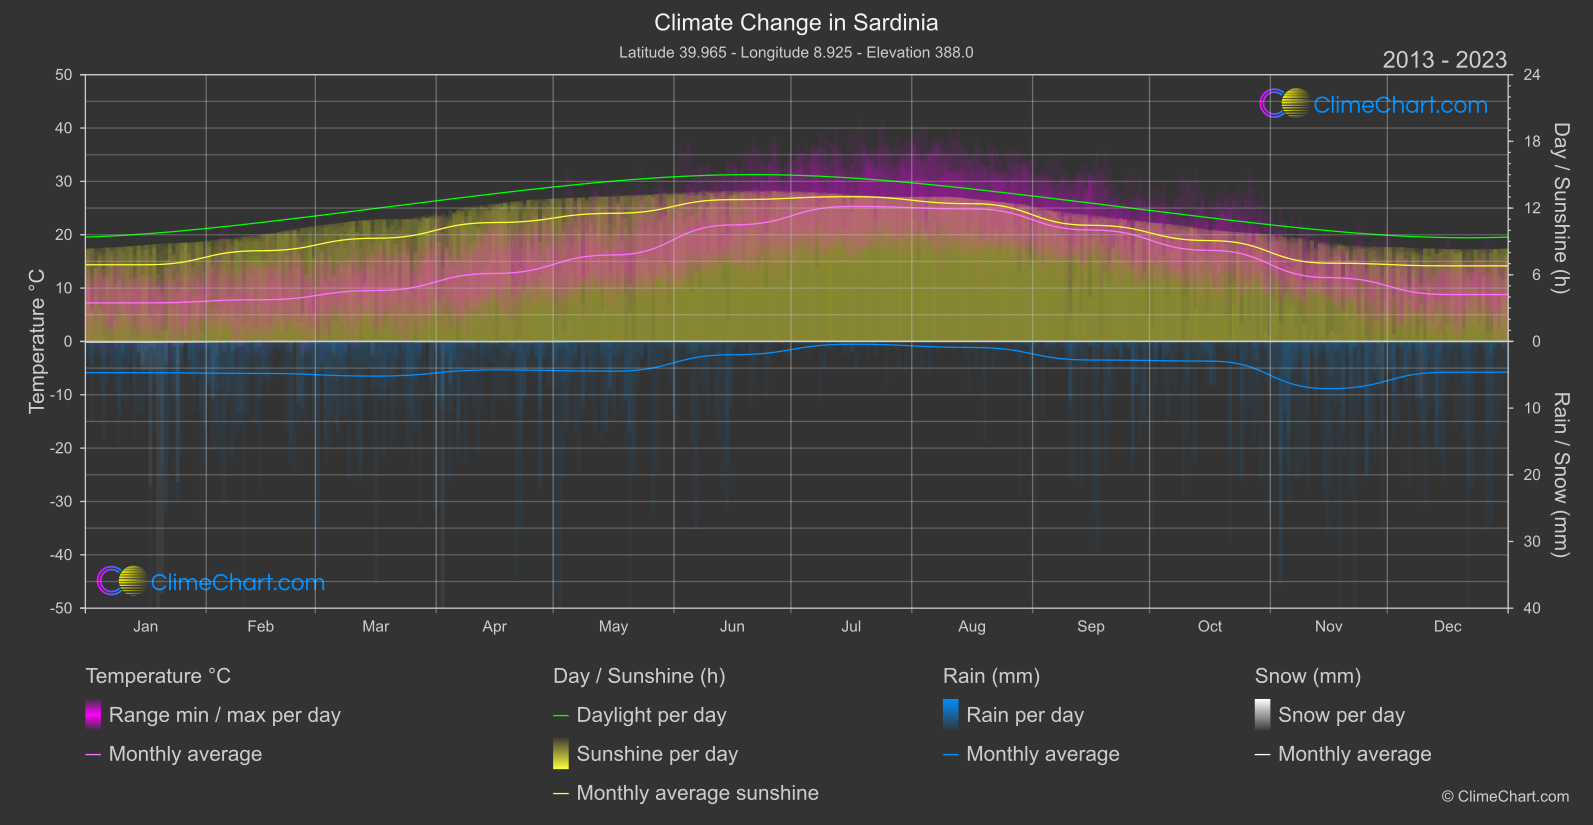
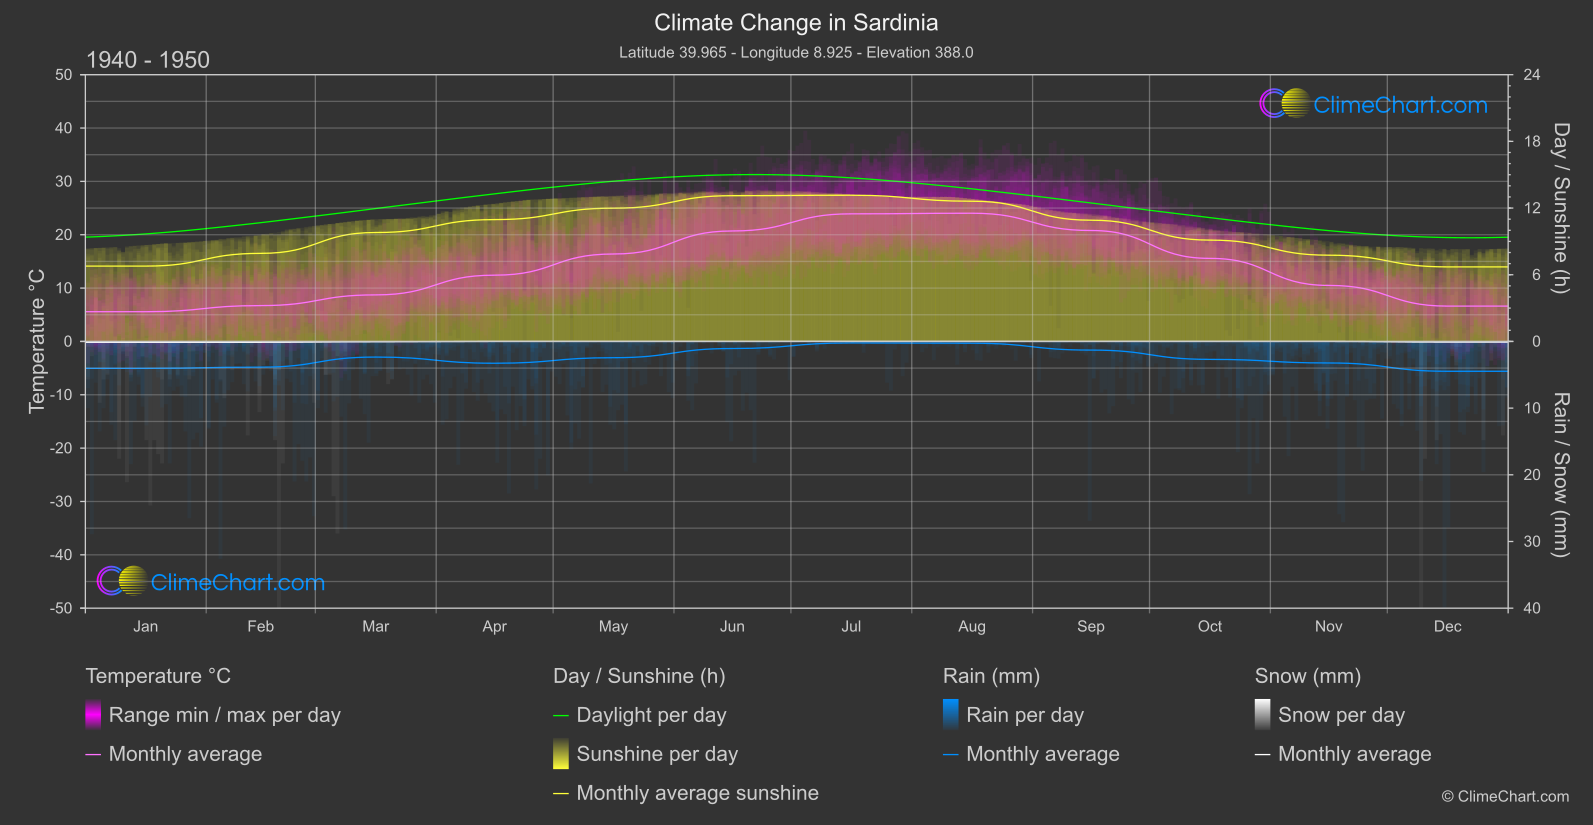
Sardinia, Italy, has experienced notable changes in its climate over the years. From the data analysis, it is evident that the month with the highest temperature change is December, with an increase of 2.16°C from 1940-1950 to 2013-2024. In terms of rainfall, November shows the most significant change, with an increase of 1.92 mm. Snowfall remains minimal in Sardinia, with slight fluctuations observed. Sunshine duration sees varying trends across different months, with notable changes in November and September.
Climate Change Data Overview for Sardinia, Italy
Explore the comprehensive climate change data for Sardinia, Italy. This detailed table provides valuable insights into temperature variations, precipitation levels, and seasonal changes influenced by climate change, helping you understand the unique weather patterns of this region.
Temperature °C
| Month | ⌀ 1940 - 1950 | ⌀ 2013 - 2023 | +/- |
|---|---|---|---|
| Jan | 5.57 | 7.22 | 1.65 |
| Feb | 6.72 | 7.81 | 1.09 |
| Mar | 8.72 | 9.53 | 0.81 |
| Apr | 12.42 | 12.74 | 0.32 |
| May | 16.39 | 16.22 | -0.17 |
| Jun | 20.71 | 21.84 | 1.13 |
| Jul | 23.92 | 25.31 | 1.39 |
| Aug | 24.03 | 24.84 | 0.81 |
| Sep | 20.79 | 20.89 | 0.10 |
| Oct | 15.57 | 17.06 | 1.49 |
| Nov | 10.50 | 11.96 | 1.46 |
| Dec | 6.62 | 8.78 | 2.16 |
| ⌀ Month | 14.33 | 15.35 | 1.02 |
Sunshine (h)
| Month | ⌀ 1940 - 1950 | ⌀ 2013 - 2023 | +/- |
|---|---|---|---|
| Jan | 6.78 | 6.90 | 0.12 |
| Feb | 7.92 | 8.16 | 0.24 |
| Mar | 9.80 | 9.29 | -0.51 |
| Apr | 10.96 | 10.70 | -0.26 |
| May | 11.99 | 11.53 | -0.46 |
| Jun | 13.11 | 12.76 | -0.35 |
| Jul | 13.15 | 13.02 | -0.13 |
| Aug | 12.61 | 12.39 | -0.22 |
| Sep | 10.91 | 10.45 | -0.46 |
| Oct | 9.12 | 9.07 | -0.05 |
| Nov | 7.76 | 7.04 | -0.72 |
| Dec | 6.71 | 6.80 | 0.10 |
| ⌀ Month | 10.07 | 9.84 | -0.23 |
Rain (mm)
| Month | ⌀ 1940 - 1950 | ⌀ 2013 - 2023 | +/- |
|---|---|---|---|
| Jan | 2.02 | 2.35 | 0.33 |
| Feb | 1.93 | 2.40 | 0.47 |
| Mar | 1.17 | 2.60 | 1.43 |
| Apr | 1.64 | 2.13 | 0.50 |
| May | 1.22 | 2.23 | 1.01 |
| Jun | 0.53 | 1.00 | 0.47 |
| Jul | 0.11 | 0.21 | 0.10 |
| Aug | 0.13 | 0.45 | 0.32 |
| Sep | 0.65 | 1.39 | 0.74 |
| Oct | 1.35 | 1.48 | 0.13 |
| Nov | 1.61 | 3.54 | 1.92 |
| Dec | 2.24 | 2.30 | 0.07 |
| ⌀ Month | 1.22 | 1.84 | 0.62 |
Snow (mm)
| Month | ⌀ 1940 - 1950 | ⌀ 2013 - 2023 | +/- |
|---|---|---|---|
| Jan | 0.07 | 0.04 | -0.02 |
| Feb | 0.06 | 0.01 | -0.05 |
| Mar | 0.03 | 0.00 | -0.02 |
| Apr | 0.00 | 0.02 | 0.02 |
| May | 0.00 | 0.00 | 0.00 |
| Jun | 0.00 | 0.00 | 0.00 |
| Jul | 0.00 | 0.00 | 0.00 |
| Aug | 0.00 | 0.00 | 0.00 |
| Sep | 0.00 | 0.00 | 0.00 |
| Oct | 0.00 | 0.00 | 0.00 |
| Nov | 0.00 | 0.00 | 0.00 |
| Dec | 0.05 | 0.00 | -0.05 |
| ⌀ Month | 0.02 | 0.01 | -0.01 |