Climate Change Chart of Sapporo, Japan
Comprehensive Climate Change Chart of Sapporo, Japan: Monthly Averages and Impact Trends
Explore the changing climate in Sapporo, Japan, through insightful data analysis.
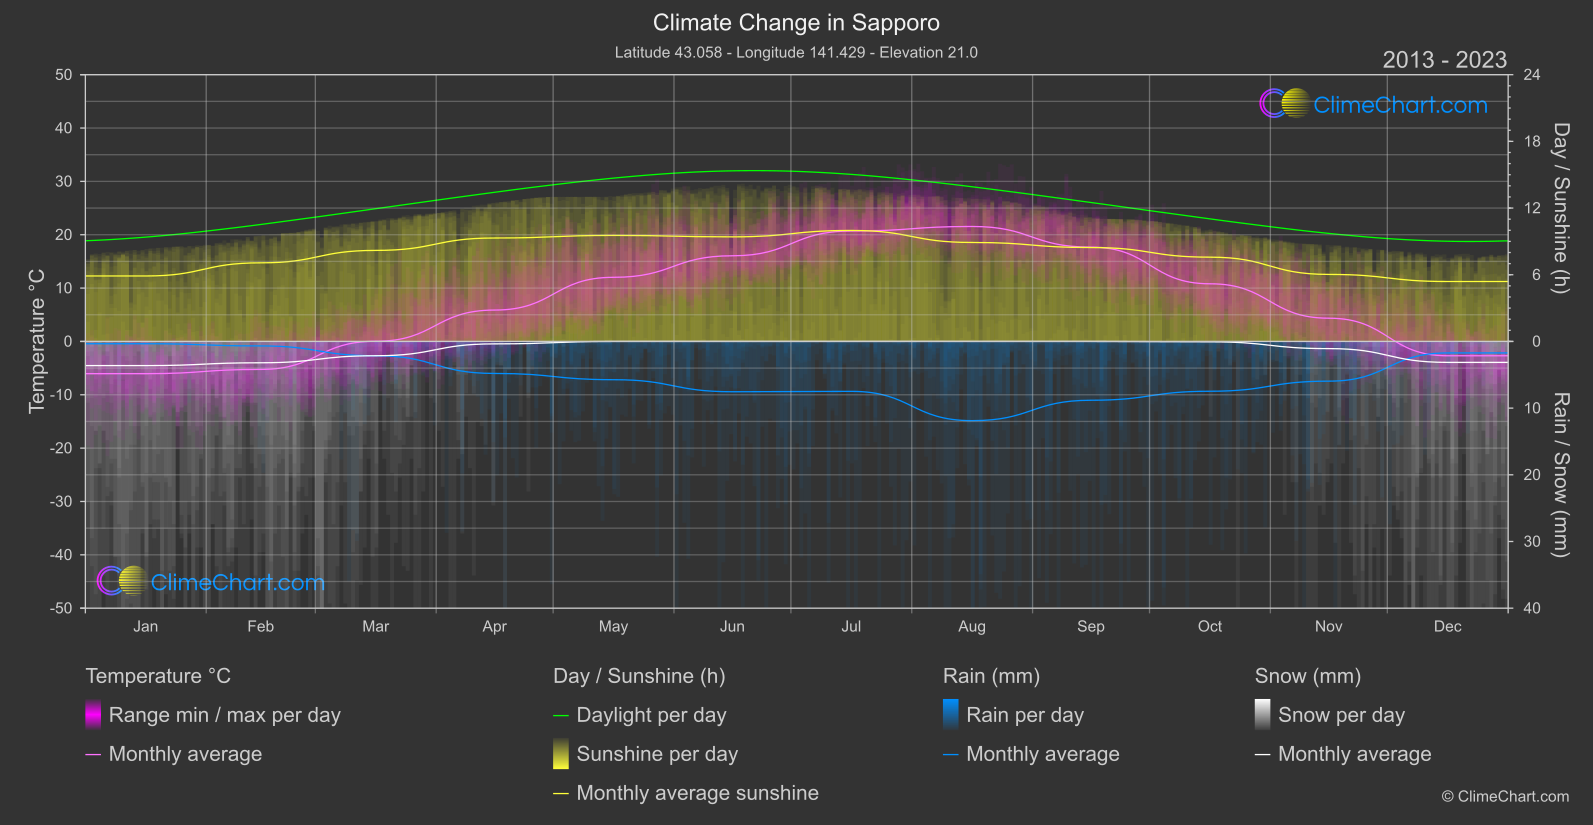
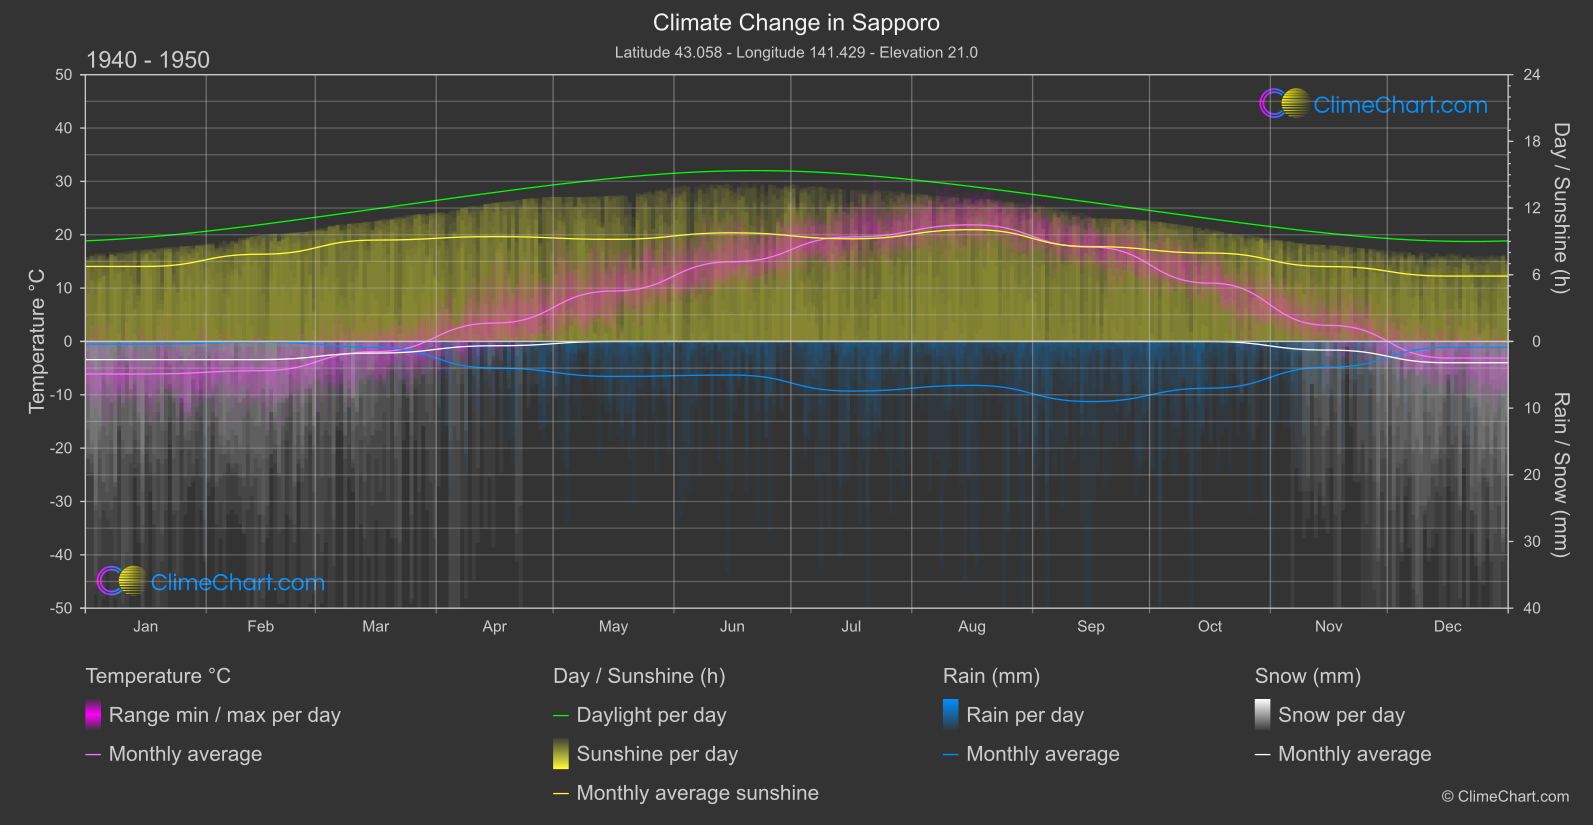
Sapporo, Japan, experiences notable changes in temperature, rainfall, snowfall, and sunshine duration. The data from 1940 to 1950 compared to 2013 to 2024 reveals interesting trends. For example, the month with the highest temperature change is March, with a significant increase of 1.93°C. On the other hand, the month with the highest rainfall change is August, showing a substantial increase of 2.65mm. Dive into the detailed insights to understand the evolving climate in Sapporo.
Climate Change Data Overview for Sapporo, Japan
Explore the comprehensive climate change data for Sapporo, Japan. This detailed table provides valuable insights into temperature variations, precipitation levels, and seasonal changes influenced by climate change, helping you understand the unique weather patterns of this region.
Temperature °C
| Month | ⌀ 1940 - 1950 | ⌀ 2013 - 2023 | +/- |
|---|---|---|---|
| Jan | -6.11 | -6.04 | 0.06 |
| Feb | -5.49 | -5.24 | 0.25 |
| Mar | -1.90 | 0.03 | 1.93 |
| Apr | 3.44 | 5.88 | 2.44 |
| May | 9.45 | 12.02 | 2.57 |
| Jun | 14.93 | 16.06 | 1.13 |
| Jul | 19.59 | 20.70 | 1.11 |
| Aug | 21.86 | 21.55 | -0.31 |
| Sep | 17.68 | 17.67 | -0.01 |
| Oct | 10.93 | 10.80 | -0.13 |
| Nov | 3.01 | 4.35 | 1.34 |
| Dec | -3.11 | -2.69 | 0.42 |
| ⌀ Month | 7.02 | 7.92 | 0.90 |
Sunshine (h)
| Month | ⌀ 1940 - 1950 | ⌀ 2013 - 2023 | +/- |
|---|---|---|---|
| Jan | 6.75 | 5.89 | -0.86 |
| Feb | 7.85 | 7.07 | -0.78 |
| Mar | 9.12 | 8.19 | -0.93 |
| Apr | 9.43 | 9.31 | -0.13 |
| May | 9.18 | 9.54 | 0.35 |
| Jun | 9.77 | 9.41 | -0.36 |
| Jul | 9.23 | 9.99 | 0.75 |
| Aug | 10.06 | 8.90 | -1.15 |
| Sep | 8.53 | 8.45 | -0.09 |
| Oct | 7.96 | 7.58 | -0.37 |
| Nov | 6.74 | 6.03 | -0.71 |
| Dec | 5.88 | 5.39 | -0.49 |
| ⌀ Month | 8.37 | 7.98 | -0.40 |
Rain (mm)
| Month | ⌀ 1940 - 1950 | ⌀ 2013 - 2023 | +/- |
|---|---|---|---|
| Jan | 0.21 | 0.17 | -0.04 |
| Feb | 0.04 | 0.34 | 0.30 |
| Mar | 0.44 | 1.07 | 0.63 |
| Apr | 2.00 | 2.40 | 0.40 |
| May | 2.62 | 2.87 | 0.25 |
| Jun | 2.52 | 3.77 | 1.25 |
| Jul | 3.72 | 3.74 | 0.02 |
| Aug | 3.29 | 5.94 | 2.65 |
| Sep | 4.51 | 4.41 | -0.10 |
| Oct | 3.50 | 3.73 | 0.23 |
| Nov | 1.93 | 2.98 | 1.05 |
| Dec | 0.44 | 0.86 | 0.43 |
| ⌀ Month | 2.10 | 2.69 | 0.59 |
Snow (mm)
| Month | ⌀ 1940 - 1950 | ⌀ 2013 - 2023 | +/- |
|---|---|---|---|
| Jan | 1.36 | 1.81 | 0.45 |
| Feb | 1.36 | 1.60 | 0.24 |
| Mar | 0.87 | 1.07 | 0.20 |
| Apr | 0.33 | 0.18 | -0.14 |
| May | 0.00 | 0.00 | -0.00 |
| Jun | 0.00 | 0.00 | 0.00 |
| Jul | 0.00 | 0.00 | 0.00 |
| Aug | 0.00 | 0.00 | 0.00 |
| Sep | 0.00 | 0.00 | 0.00 |
| Oct | 0.01 | 0.03 | 0.02 |
| Nov | 0.65 | 0.54 | -0.11 |
| Dec | 1.60 | 1.57 | -0.03 |
| ⌀ Month | 0.52 | 0.57 | 0.05 |