Climate Change Chart of São Tomé, Sao Tome and Principe
Comprehensive Climate Change Chart of São Tomé, Sao Tome and Principe: Monthly Averages and Impact Trends
Exploring the climate change data for São Tomé, Sao Tome and Principe reveals significant shifts in temperature, rainfall, and sunshine duration over the years. Let's delve into the insights provided by the datasets.
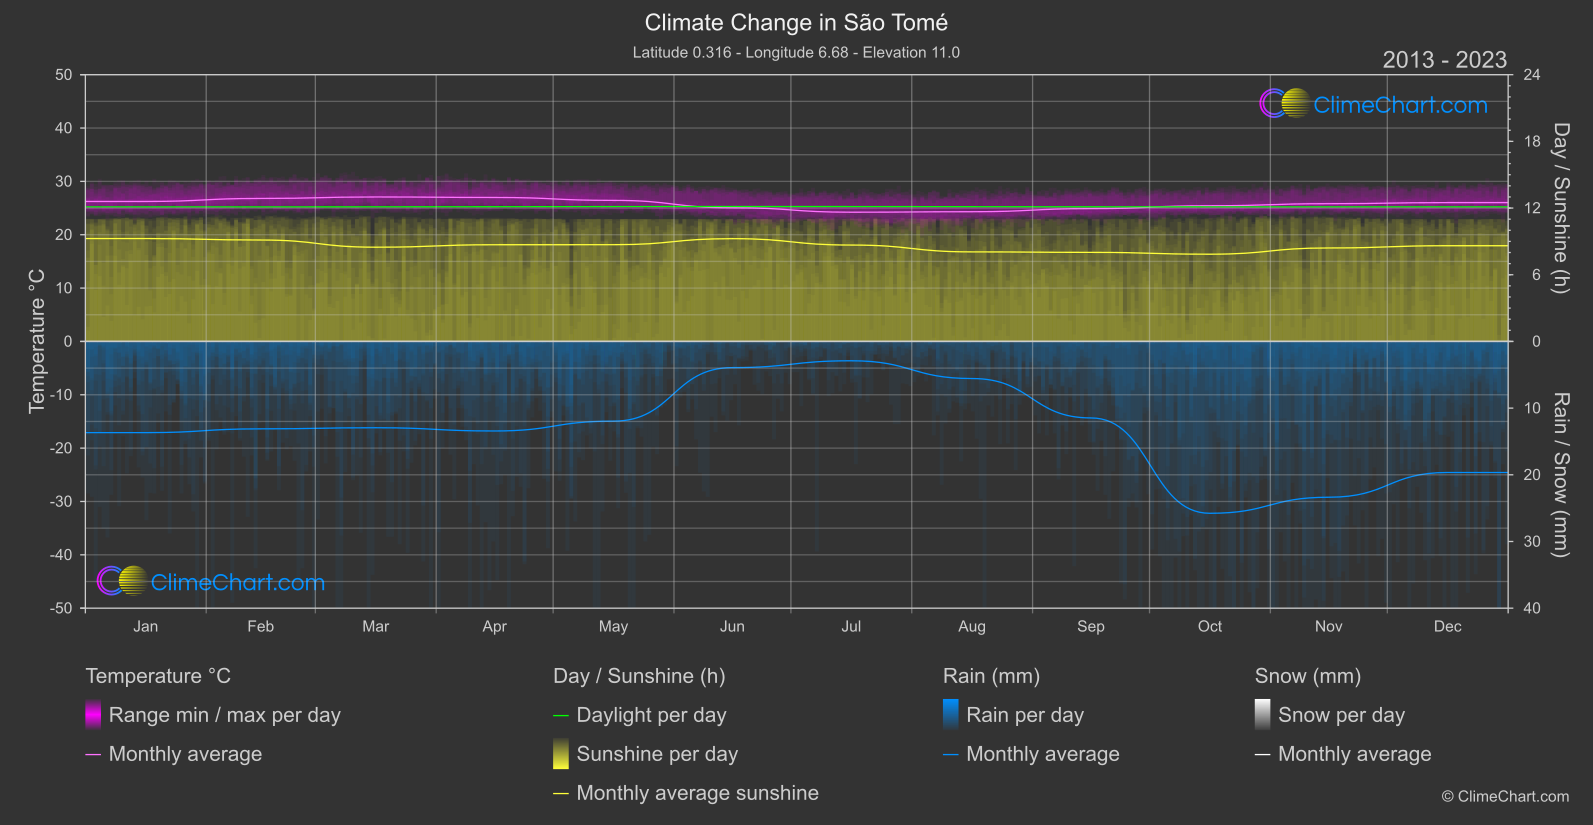
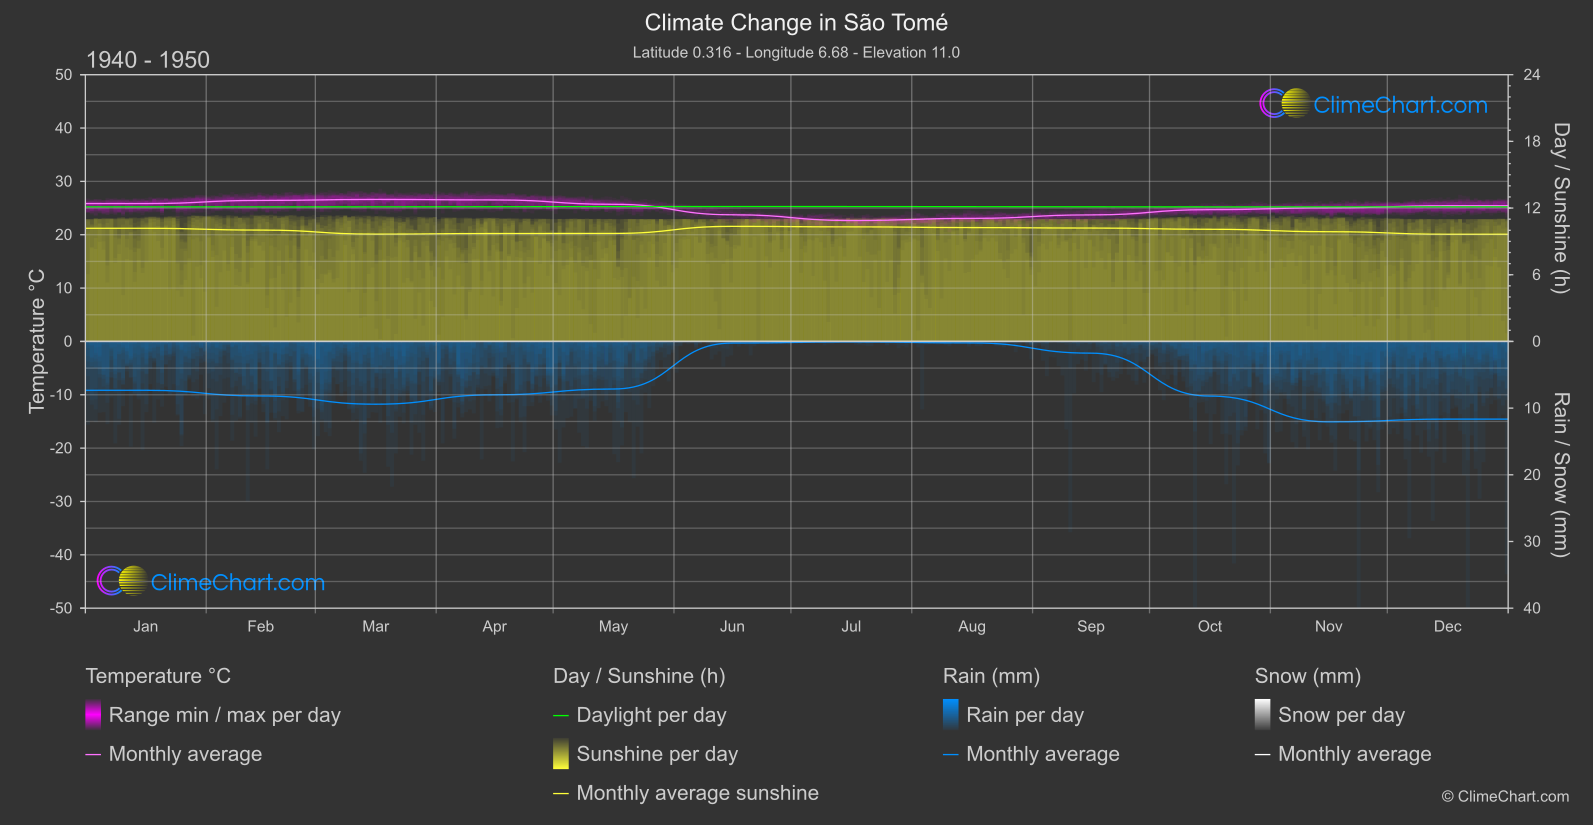
São Tomé and Príncipe, located in the Gulf of Guinea, experiences notable climate changes as depicted in the datasets. The comparison between the temperature, rainfall, and sunshine duration from the 1940s-1950s to the recent years of 2013-2024 reveals intriguing patterns. For instance, the month of June shows a substantial increase in temperature by 1.32°C, indicating a significant warming trend. On the other hand, September exhibits a considerable rise in rainfall by 4.86mm, suggesting a shift in precipitation patterns. Moreover, the sunshine duration in August has decreased by 2.19 hours, highlighting changes in cloud cover and atmospheric conditions.
Climate Change Data Overview for São Tomé, Sao Tome and Principe
Explore the comprehensive climate change data for São Tomé, Sao Tome and Principe. This detailed table provides valuable insights into temperature variations, precipitation levels, and seasonal changes influenced by climate change, helping you understand the unique weather patterns of this region.
Temperature °C
| Month | ⌀ 1940 - 1950 | ⌀ 2013 - 2023 | +/- |
|---|---|---|---|
| Jan | 25.84 | 26.24 | 0.39 |
| Feb | 26.43 | 26.80 | 0.37 |
| Mar | 26.62 | 27.08 | 0.46 |
| Apr | 26.52 | 26.99 | 0.46 |
| May | 25.70 | 26.44 | 0.73 |
| Jun | 23.74 | 25.05 | 1.32 |
| Jul | 22.67 | 24.22 | 1.56 |
| Aug | 23.07 | 24.31 | 1.25 |
| Sep | 23.72 | 24.89 | 1.18 |
| Oct | 24.70 | 25.43 | 0.73 |
| Nov | 25.04 | 25.82 | 0.78 |
| Dec | 25.44 | 26.02 | 0.58 |
| ⌀ Month | 24.96 | 25.77 | 0.82 |
Sunshine (h)
| Month | ⌀ 1940 - 1950 | ⌀ 2013 - 2023 | +/- |
|---|---|---|---|
| Jan | 10.18 | 9.26 | -0.92 |
| Feb | 10.02 | 9.13 | -0.89 |
| Mar | 9.65 | 8.48 | -1.17 |
| Apr | 9.71 | 8.70 | -1.01 |
| May | 9.72 | 8.70 | -1.01 |
| Jun | 10.35 | 9.25 | -1.11 |
| Jul | 10.31 | 8.67 | -1.64 |
| Aug | 10.24 | 8.06 | -2.19 |
| Sep | 10.20 | 8.01 | -2.19 |
| Oct | 10.09 | 7.85 | -2.24 |
| Nov | 9.87 | 8.41 | -1.46 |
| Dec | 9.64 | 8.61 | -1.03 |
| ⌀ Month | 10.00 | 8.59 | -1.41 |
Rain (mm)
| Month | ⌀ 1940 - 1950 | ⌀ 2013 - 2023 | +/- |
|---|---|---|---|
| Jan | 3.66 | 6.84 | 3.17 |
| Feb | 4.09 | 6.55 | 2.47 |
| Mar | 4.71 | 6.47 | 1.77 |
| Apr | 4.00 | 6.71 | 2.71 |
| May | 3.57 | 5.98 | 2.41 |
| Jun | 0.12 | 1.96 | 1.84 |
| Jul | 0.04 | 1.45 | 1.41 |
| Aug | 0.11 | 2.78 | 2.67 |
| Sep | 0.88 | 5.74 | 4.86 |
| Oct | 4.10 | 12.89 | 8.79 |
| Nov | 6.03 | 11.68 | 5.65 |
| Dec | 5.82 | 9.83 | 4.00 |
| ⌀ Month | 3.09 | 6.57 | 3.48 |
Snow (mm)
| Month | ⌀ 1940 - 1950 | ⌀ 2013 - 2023 | +/- |
|---|---|---|---|
| Jan | 0.00 | 0.00 | 0.00 |
| Feb | 0.00 | 0.00 | 0.00 |
| Mar | 0.00 | 0.00 | 0.00 |
| Apr | 0.00 | 0.00 | 0.00 |
| May | 0.00 | 0.00 | 0.00 |
| Jun | 0.00 | 0.00 | 0.00 |
| Jul | 0.00 | 0.00 | 0.00 |
| Aug | 0.00 | 0.00 | 0.00 |
| Sep | 0.00 | 0.00 | 0.00 |
| Oct | 0.00 | 0.00 | 0.00 |
| Nov | 0.00 | 0.00 | 0.00 |
| Dec | 0.00 | 0.00 | 0.00 |
| ⌀ Month | 0.00 | 0.00 | 0.00 |