Climate Change Chart of Santa Cruz de la Sierra, Bolivia
Comprehensive Climate Change Chart of Santa Cruz de la Sierra, Bolivia: Monthly Averages and Impact Trends
Explore the changing climate in Santa Cruz de la Sierra, Bolivia, through detailed data analysis. Discover the trends and patterns in temperature, rainfall, and sunshine duration over the years.
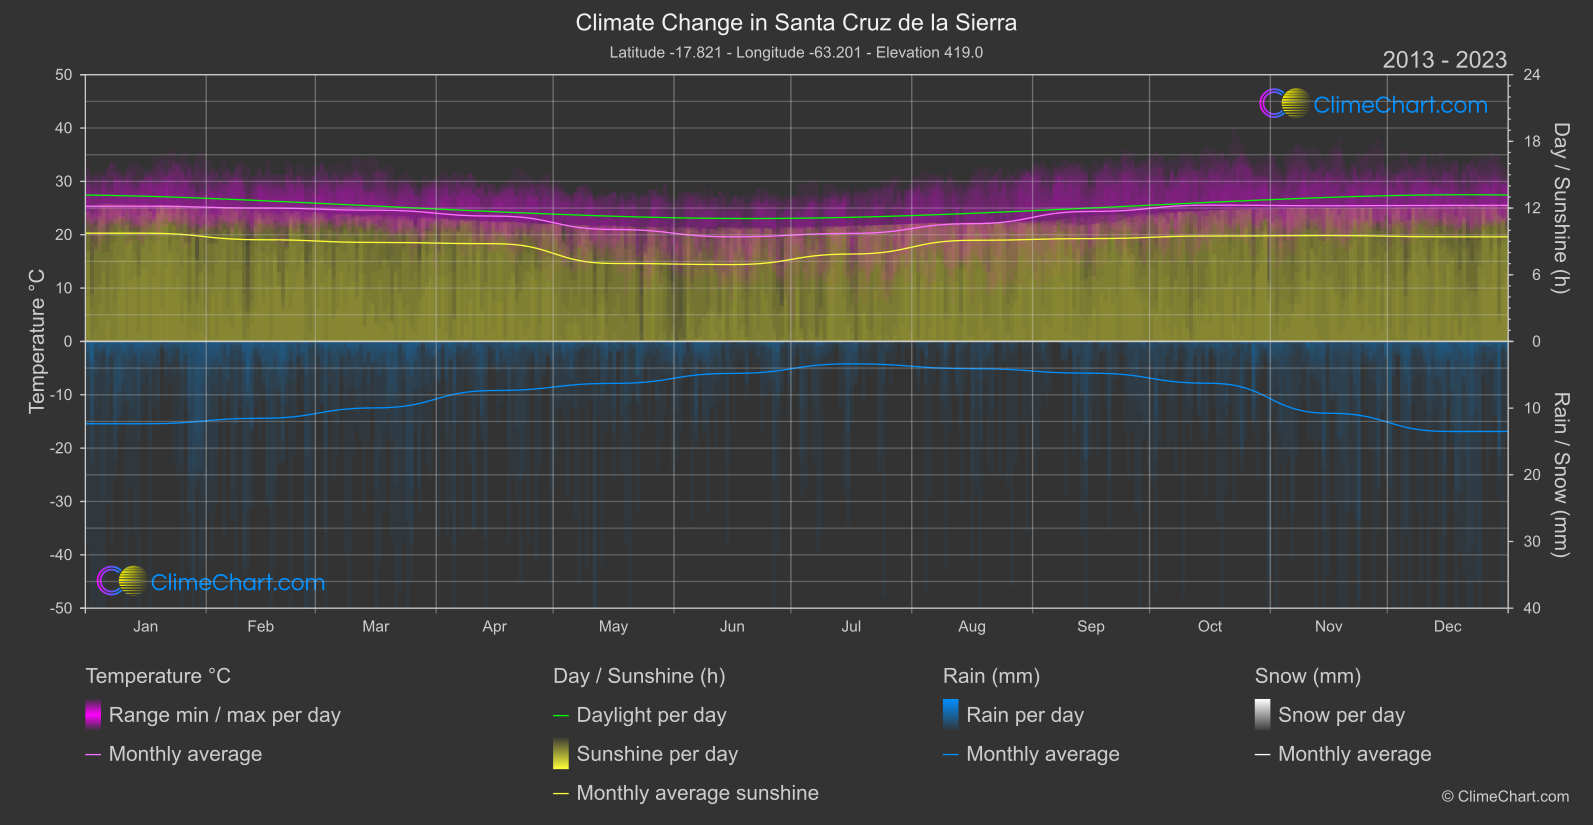
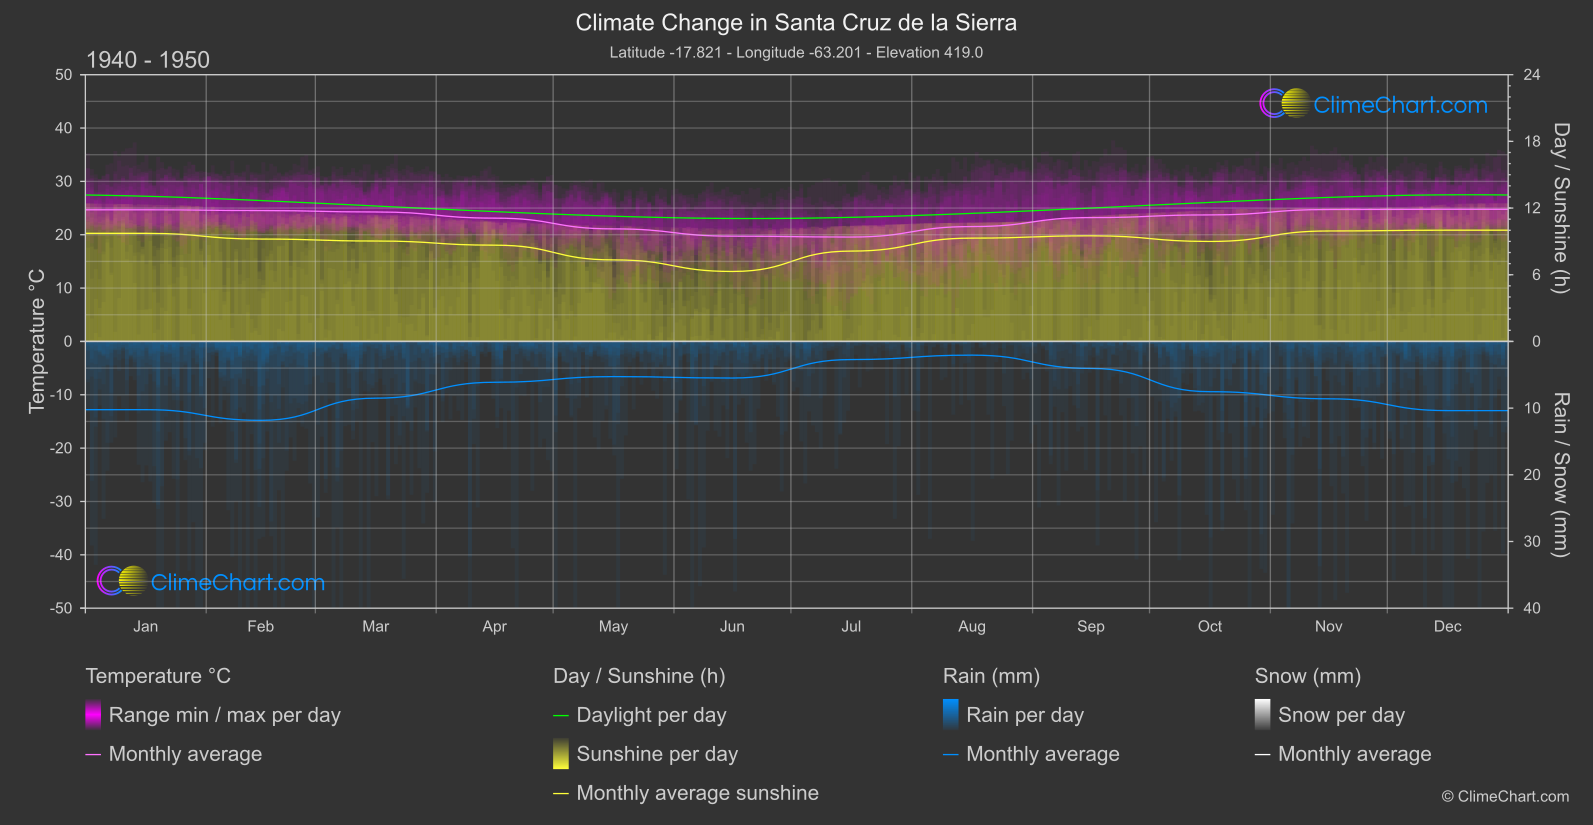
Santa Cruz de la Sierra, Bolivia, has experienced notable changes in its climate over the years. Analyzing the data from the 1940s to 1950s compared to the period from 2013 to 2024, we observe significant shifts in temperature, rainfall, and sunshine duration. The month with the highest temperature change is October, showing an increase of 1.83°C. In terms of rainfall, December exhibits the largest change with a rise of 1.56mm. There are fluctuations in sunshine duration as well, with June seeing a notable increase of 0.62 hours.
Climate Change Data Overview for Santa Cruz de la Sierra, Bolivia
Explore the comprehensive climate change data for Santa Cruz de la Sierra, Bolivia. This detailed table provides valuable insights into temperature variations, precipitation levels, and seasonal changes influenced by climate change, helping you understand the unique weather patterns of this region.
Temperature °C
| Month | ⌀ 1940 - 1950 | ⌀ 2013 - 2023 | +/- |
|---|---|---|---|
| Jan | 24.68 | 25.34 | 0.67 |
| Feb | 24.53 | 25.00 | 0.47 |
| Mar | 24.26 | 24.60 | 0.33 |
| Apr | 23.11 | 23.49 | 0.38 |
| May | 21.10 | 20.99 | -0.11 |
| Jun | 19.73 | 19.61 | -0.12 |
| Jul | 19.57 | 20.25 | 0.68 |
| Aug | 21.53 | 22.07 | 0.54 |
| Sep | 23.21 | 24.37 | 1.16 |
| Oct | 23.72 | 25.55 | 1.83 |
| Nov | 24.73 | 25.43 | 0.70 |
| Dec | 24.77 | 25.49 | 0.73 |
| ⌀ Month | 22.91 | 23.52 | 0.61 |
Sunshine (h)
| Month | ⌀ 1940 - 1950 | ⌀ 2013 - 2023 | +/- |
|---|---|---|---|
| Jan | 9.73 | 9.74 | 0.01 |
| Feb | 9.21 | 9.15 | -0.06 |
| Mar | 9.03 | 8.91 | -0.13 |
| Apr | 8.66 | 8.79 | 0.13 |
| May | 7.34 | 7.01 | -0.32 |
| Jun | 6.30 | 6.92 | 0.62 |
| Jul | 8.13 | 7.86 | -0.27 |
| Aug | 9.29 | 9.10 | -0.19 |
| Sep | 9.50 | 9.25 | -0.25 |
| Oct | 9.00 | 9.49 | 0.49 |
| Nov | 9.94 | 9.53 | -0.41 |
| Dec | 10.01 | 9.41 | -0.60 |
| ⌀ Month | 8.84 | 8.76 | -0.08 |
Rain (mm)
| Month | ⌀ 1940 - 1950 | ⌀ 2013 - 2023 | +/- |
|---|---|---|---|
| Jan | 5.12 | 6.17 | 1.06 |
| Feb | 5.92 | 5.76 | -0.16 |
| Mar | 4.25 | 4.98 | 0.73 |
| Apr | 3.06 | 3.68 | 0.62 |
| May | 2.64 | 3.15 | 0.51 |
| Jun | 2.74 | 2.40 | -0.35 |
| Jul | 1.36 | 1.68 | 0.32 |
| Aug | 1.03 | 2.04 | 1.01 |
| Sep | 2.02 | 2.38 | 0.36 |
| Oct | 3.77 | 3.14 | -0.63 |
| Nov | 4.30 | 5.38 | 1.08 |
| Dec | 5.19 | 6.75 | 1.56 |
| ⌀ Month | 3.45 | 3.96 | 0.51 |
Snow (mm)
| Month | ⌀ 1940 - 1950 | ⌀ 2013 - 2023 | +/- |
|---|---|---|---|
| Jan | 0.00 | 0.00 | 0.00 |
| Feb | 0.00 | 0.00 | 0.00 |
| Mar | 0.00 | 0.00 | 0.00 |
| Apr | 0.00 | 0.00 | 0.00 |
| May | 0.00 | 0.00 | 0.00 |
| Jun | 0.00 | 0.00 | 0.00 |
| Jul | 0.00 | 0.00 | 0.00 |
| Aug | 0.00 | 0.00 | 0.00 |
| Sep | 0.00 | 0.00 | 0.00 |
| Oct | 0.00 | 0.00 | 0.00 |
| Nov | 0.00 | 0.00 | 0.00 |
| Dec | 0.00 | 0.00 | 0.00 |
| ⌀ Month | 0.00 | 0.00 | 0.00 |