Climate Change Chart of San Salvador, El Salvador
Comprehensive Climate Change Chart of San Salvador, El Salvador: Monthly Averages and Impact Trends
Exploring the changing climate in San Salvador, El Salvador reveals intriguing insights into temperature, rainfall, and sunshine duration trends. Discover how climate patterns have evolved over the years.
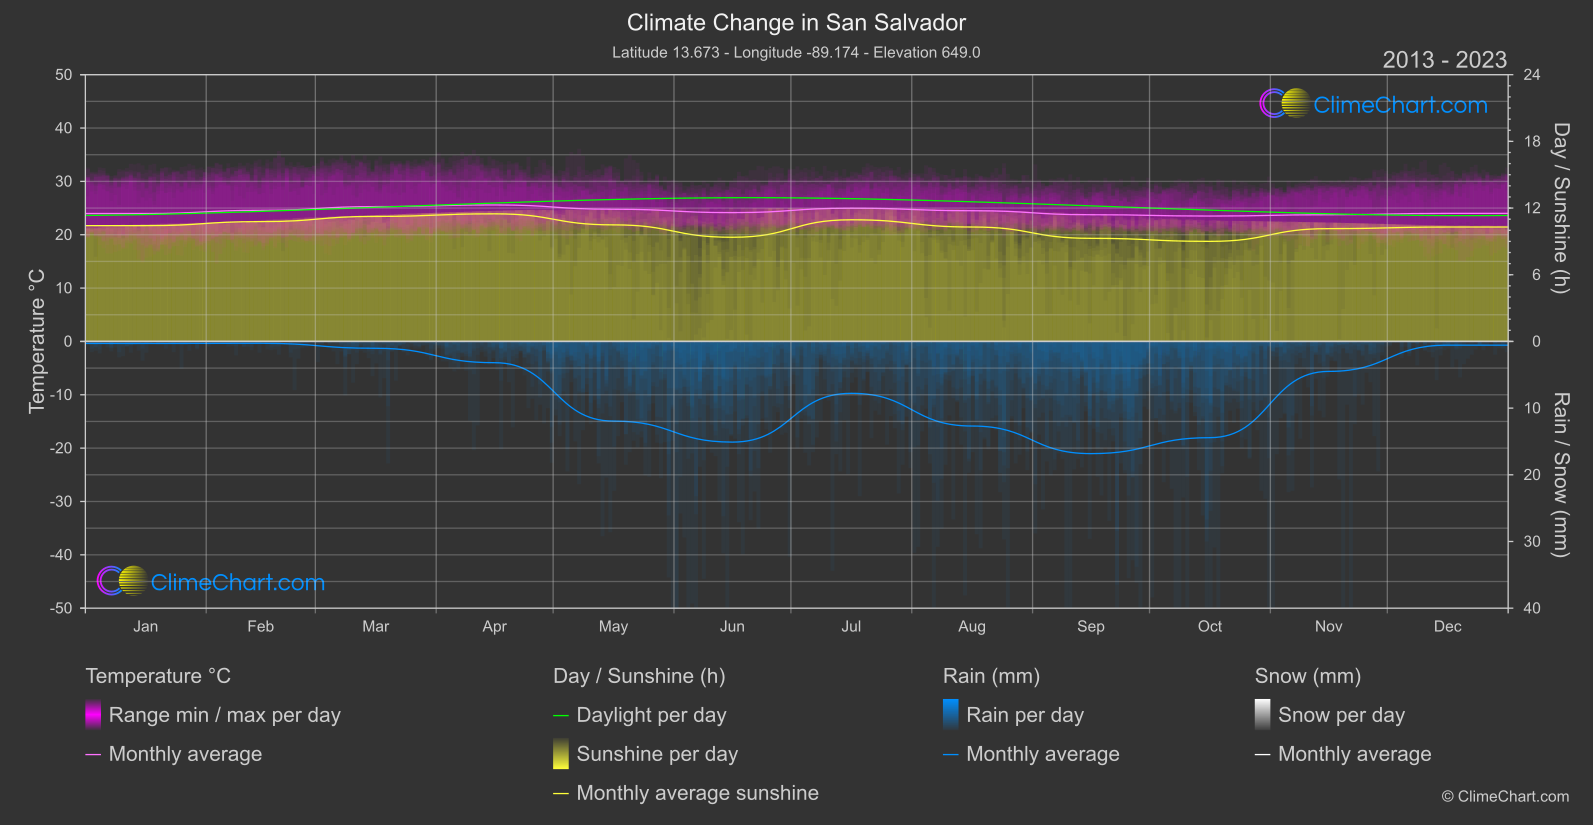
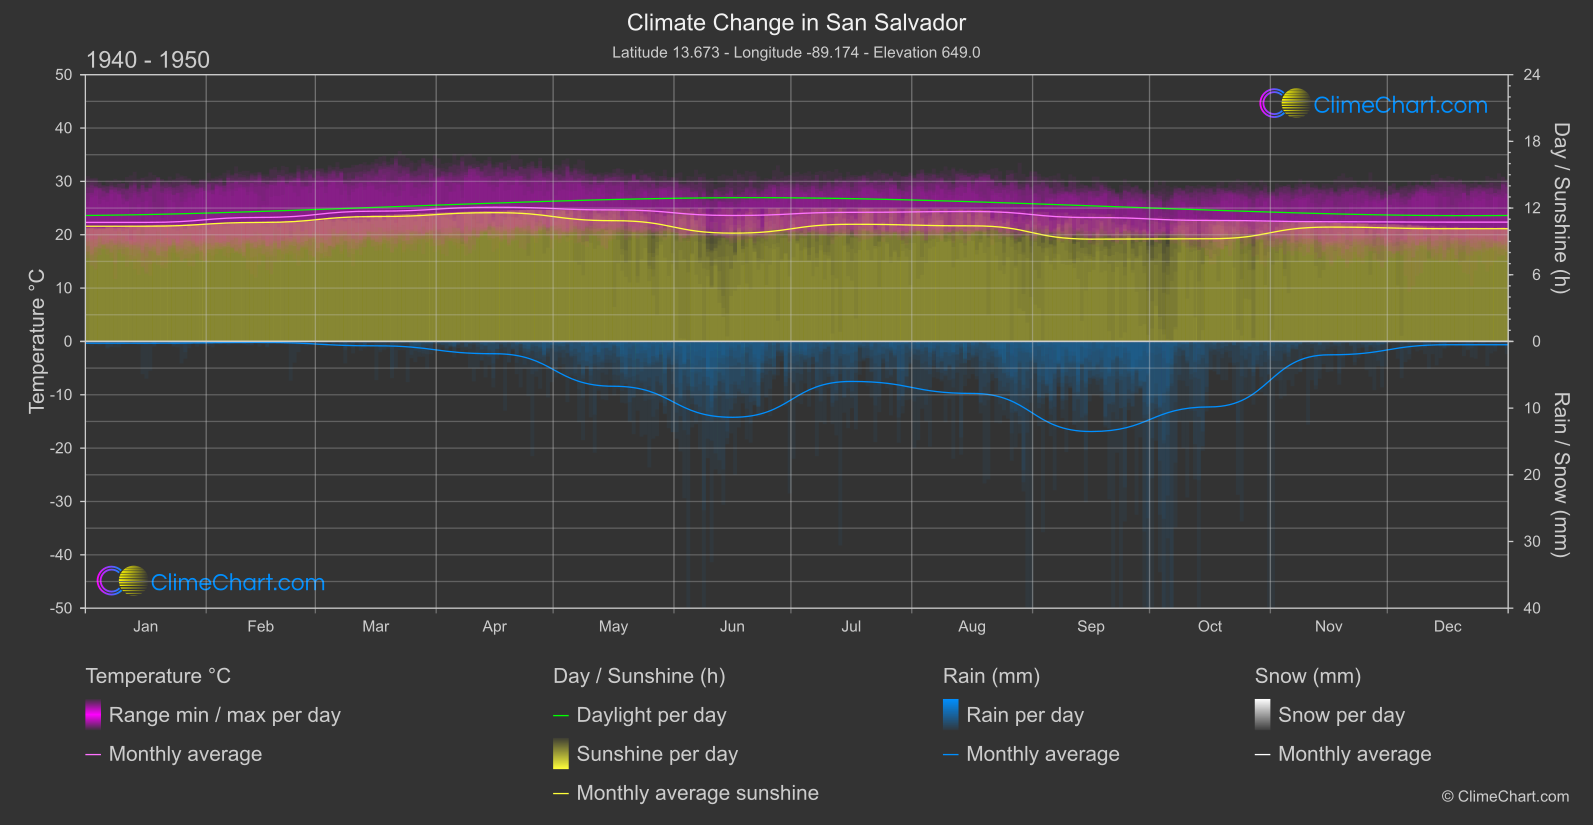
The climate data for San Salvador, El Salvador, highlights how temperatures have increased over the years, with notable changes in rainfall patterns. In terms of temperature changes, December showed the highest increase of 1.64°C, while April had the smallest change of 0.43°C. Regarding rainfall, May experienced the largest increase of 2.61mm, whereas December had the smallest change of 0.03mm. Sunshine duration also exhibited variations, with June seeing a decrease of 0.37 hours, while July had the highest increase of 0.40 hours.
Climate Change Data Overview for San Salvador, El Salvador
Explore the comprehensive climate change data for San Salvador, El Salvador. This detailed table provides valuable insights into temperature variations, precipitation levels, and seasonal changes influenced by climate change, helping you understand the unique weather patterns of this region.
Temperature °C
| Month | ⌀ 1940 - 1950 | ⌀ 2013 - 2023 | +/- |
|---|---|---|---|
| Jan | 22.31 | 23.97 | 1.66 |
| Feb | 23.25 | 24.57 | 1.32 |
| Mar | 24.42 | 25.27 | 0.85 |
| Apr | 25.15 | 25.58 | 0.43 |
| May | 24.65 | 24.78 | 0.13 |
| Jun | 23.61 | 24.15 | 0.54 |
| Jul | 24.20 | 24.97 | 0.77 |
| Aug | 24.36 | 24.50 | 0.15 |
| Sep | 23.22 | 23.75 | 0.53 |
| Oct | 22.68 | 23.50 | 0.82 |
| Nov | 22.44 | 23.75 | 1.31 |
| Dec | 22.36 | 24.00 | 1.64 |
| ⌀ Month | 23.55 | 24.40 | 0.85 |
Sunshine (h)
| Month | ⌀ 1940 - 1950 | ⌀ 2013 - 2023 | +/- |
|---|---|---|---|
| Jan | 10.37 | 10.42 | 0.05 |
| Feb | 10.71 | 10.78 | 0.07 |
| Mar | 11.23 | 11.25 | 0.01 |
| Apr | 11.58 | 11.48 | -0.10 |
| May | 10.87 | 10.49 | -0.38 |
| Jun | 9.74 | 9.37 | -0.37 |
| Jul | 10.54 | 10.94 | 0.40 |
| Aug | 10.40 | 10.29 | -0.11 |
| Sep | 9.20 | 9.28 | 0.07 |
| Oct | 9.24 | 9.00 | -0.24 |
| Nov | 10.29 | 10.15 | -0.14 |
| Dec | 10.14 | 10.29 | 0.15 |
| ⌀ Month | 10.36 | 10.31 | -0.05 |
Rain (mm)
| Month | ⌀ 1940 - 1950 | ⌀ 2013 - 2023 | +/- |
|---|---|---|---|
| Jan | 0.13 | 0.15 | 0.02 |
| Feb | 0.08 | 0.14 | 0.06 |
| Mar | 0.33 | 0.51 | 0.18 |
| Apr | 0.92 | 1.59 | 0.67 |
| May | 3.36 | 5.97 | 2.61 |
| Jun | 5.69 | 7.55 | 1.86 |
| Jul | 3.00 | 3.89 | 0.89 |
| Aug | 3.90 | 6.34 | 2.45 |
| Sep | 6.75 | 8.41 | 1.66 |
| Oct | 4.91 | 7.22 | 2.31 |
| Nov | 1.00 | 2.25 | 1.24 |
| Dec | 0.25 | 0.28 | 0.03 |
| ⌀ Month | 2.53 | 3.69 | 1.17 |
Snow (mm)
| Month | ⌀ 1940 - 1950 | ⌀ 2013 - 2023 | +/- |
|---|---|---|---|
| Jan | 0.00 | 0.00 | 0.00 |
| Feb | 0.00 | 0.00 | 0.00 |
| Mar | 0.00 | 0.00 | 0.00 |
| Apr | 0.00 | 0.00 | 0.00 |
| May | 0.00 | 0.00 | 0.00 |
| Jun | 0.00 | 0.00 | 0.00 |
| Jul | 0.00 | 0.00 | 0.00 |
| Aug | 0.00 | 0.00 | 0.00 |
| Sep | 0.00 | 0.00 | 0.00 |
| Oct | 0.00 | 0.00 | 0.00 |
| Nov | 0.00 | 0.00 | 0.00 |
| Dec | 0.00 | 0.00 | 0.00 |
| ⌀ Month | 0.00 | 0.00 | 0.00 |