Climate Change Chart of San Miguel de Allende, Mexico
Comprehensive Climate Change Chart of San Miguel de Allende, Mexico: Monthly Averages and Impact Trends
Explore the changing climate in San Miguel de Allende, Mexico, through insightful data analysis. Discover how temperature, rainfall, snowfall, and sunshine duration have evolved over the years.
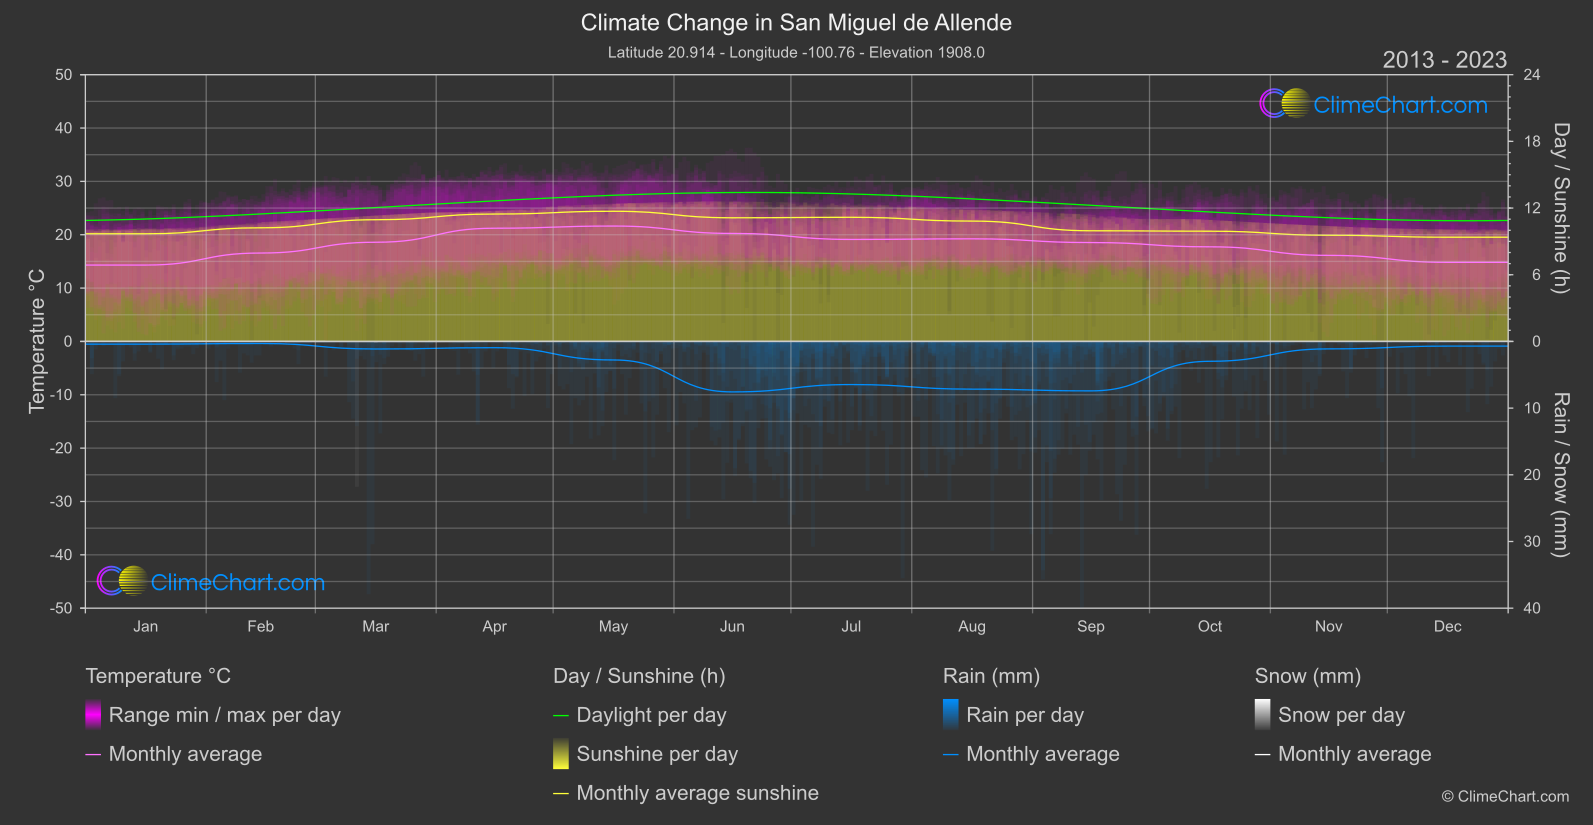
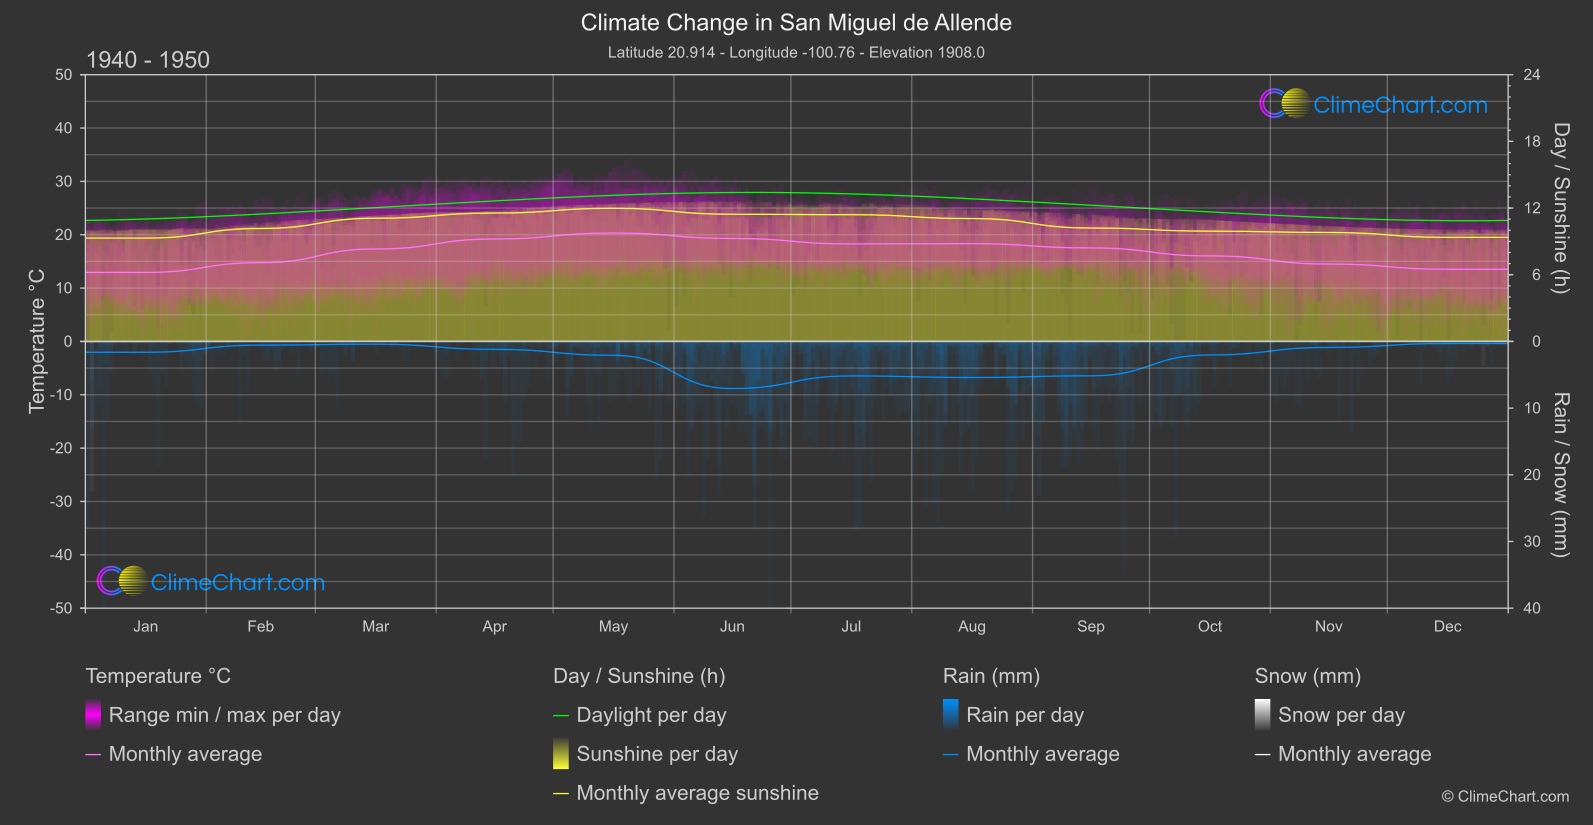
San Miguel de Allende, located in Mexico, has experienced notable changes in its climate over the years. Analyzing the data from the 1940s to 1950s compared to the period of 2013 to 2024, we observe significant shifts in various weather parameters. For instance, the month of April shows a temperature increase of 2.02°C, indicating a warming trend. In terms of rainfall, September stands out with a significant 1.13mm rise, suggesting a potential shift in precipitation patterns. Snowfall remained minimal throughout the years, with no substantial changes observed. Sunshine duration also experienced fluctuations, with some months showing a decrease in hours of sunlight. These insights provide valuable information on how the climate in San Miguel de Allende has evolved and may continue to change in the future.
Climate Change Data Overview for San Miguel de Allende, Mexico
Explore the comprehensive climate change data for San Miguel de Allende, Mexico. This detailed table provides valuable insights into temperature variations, precipitation levels, and seasonal changes influenced by climate change, helping you understand the unique weather patterns of this region.
Temperature °C
| Month | ⌀ 1940 - 1950 | ⌀ 2013 - 2023 | +/- |
|---|---|---|---|
| Jan | 12.94 | 14.32 | 1.38 |
| Feb | 14.76 | 16.57 | 1.81 |
| Mar | 17.33 | 18.59 | 1.26 |
| Apr | 19.20 | 21.22 | 2.02 |
| May | 20.33 | 21.63 | 1.30 |
| Jun | 19.30 | 20.25 | 0.94 |
| Jul | 18.27 | 19.12 | 0.85 |
| Aug | 18.32 | 19.23 | 0.91 |
| Sep | 17.53 | 18.53 | 1.01 |
| Oct | 16.03 | 17.73 | 1.70 |
| Nov | 14.50 | 16.13 | 1.63 |
| Dec | 13.53 | 14.83 | 1.30 |
| ⌀ Month | 16.84 | 18.18 | 1.34 |
Sunshine (h)
| Month | ⌀ 1940 - 1950 | ⌀ 2013 - 2023 | +/- |
|---|---|---|---|
| Jan | 9.30 | 9.68 | 0.39 |
| Feb | 10.16 | 10.22 | 0.06 |
| Mar | 11.08 | 10.95 | -0.13 |
| Apr | 11.55 | 11.46 | -0.09 |
| May | 11.98 | 11.71 | -0.27 |
| Jun | 11.44 | 11.12 | -0.32 |
| Jul | 11.40 | 11.17 | -0.23 |
| Aug | 11.05 | 10.83 | -0.23 |
| Sep | 10.20 | 9.96 | -0.25 |
| Oct | 9.92 | 9.92 | -0.00 |
| Nov | 9.80 | 9.55 | -0.25 |
| Dec | 9.36 | 9.38 | 0.01 |
| ⌀ Month | 10.60 | 10.50 | -0.11 |
Rain (mm)
| Month | ⌀ 1940 - 1950 | ⌀ 2013 - 2023 | +/- |
|---|---|---|---|
| Jan | 0.81 | 0.20 | -0.61 |
| Feb | 0.28 | 0.15 | -0.12 |
| Mar | 0.20 | 0.57 | 0.36 |
| Apr | 0.59 | 0.47 | -0.12 |
| May | 1.04 | 1.39 | 0.35 |
| Jun | 3.53 | 3.78 | 0.25 |
| Jul | 2.59 | 3.23 | 0.65 |
| Aug | 2.70 | 3.58 | 0.87 |
| Sep | 2.58 | 3.71 | 1.13 |
| Oct | 1.01 | 1.49 | 0.48 |
| Nov | 0.45 | 0.56 | 0.11 |
| Dec | 0.15 | 0.35 | 0.20 |
| ⌀ Month | 1.33 | 1.62 | 0.29 |
Snow (mm)
| Month | ⌀ 1940 - 1950 | ⌀ 2013 - 2023 | +/- |
|---|---|---|---|
| Jan | 0.01 | 0.00 | -0.01 |
| Feb | 0.00 | 0.00 | 0.00 |
| Mar | 0.00 | 0.01 | 0.01 |
| Apr | 0.00 | 0.00 | 0.00 |
| May | 0.00 | 0.00 | 0.00 |
| Jun | 0.00 | 0.00 | 0.00 |
| Jul | 0.00 | 0.00 | 0.00 |
| Aug | 0.00 | 0.00 | 0.00 |
| Sep | 0.00 | 0.00 | 0.00 |
| Oct | 0.00 | 0.00 | 0.00 |
| Nov | 0.00 | 0.00 | 0.00 |
| Dec | 0.00 | 0.00 | -0.00 |
| ⌀ Month | 0.00 | 0.00 | -0.00 |