Climate Change Chart of San Jose, USA
Comprehensive Climate Change Chart of San Jose, USA: Monthly Averages and Impact Trends
Explore the changing climate in San Jose, USA, with insights on temperature, rainfall, snowfall, and sunshine duration over the past decades.
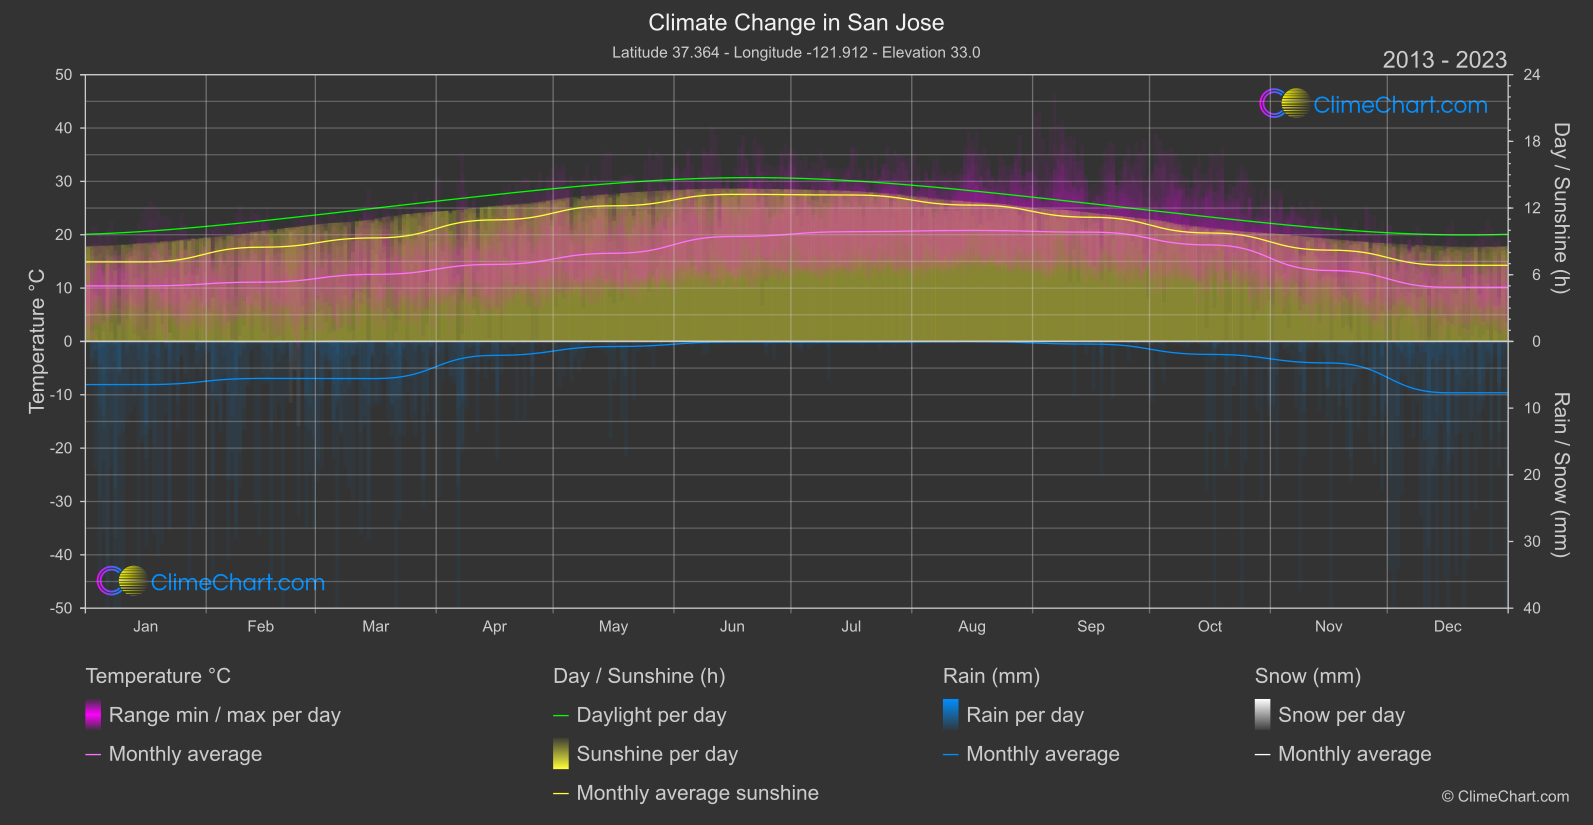
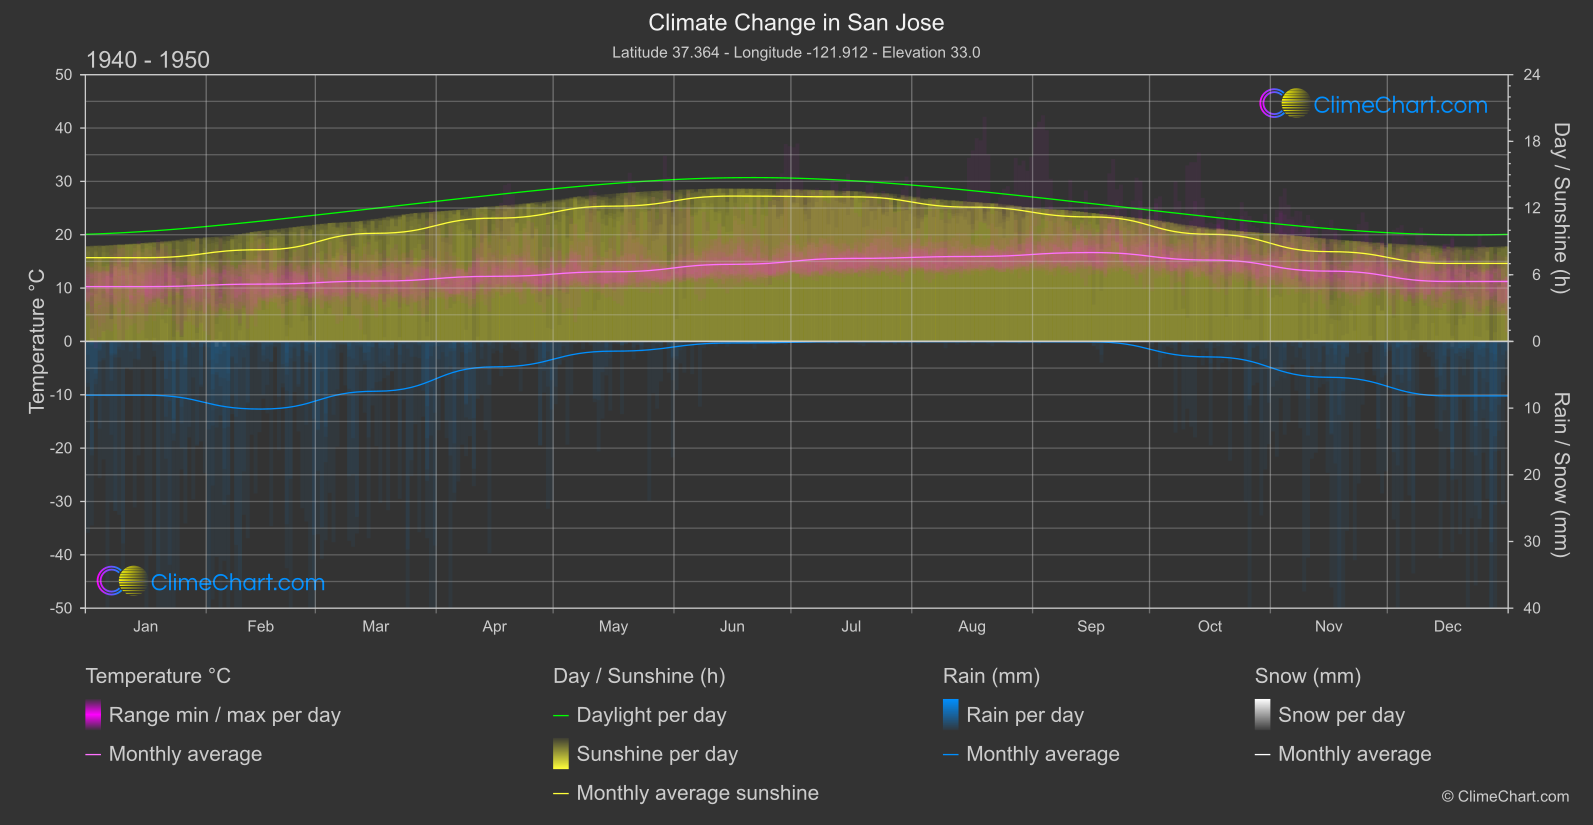
San Jose, located in the USA, has experienced significant changes in climate parameters such as temperature, rainfall, snowfall, and sunshine duration over the years. The data shows a clear trend of increasing temperatures across most months, with June experiencing the highest temperature change. In terms of rainfall, the months with the most notable changes are February and November. Snowfall has remained minimal over the years, with December showing a slight decrease in snowfall from 1940-1950 to 2013-2024. Additionally, sunshine duration has seen slight fluctuations, with August and July showing the highest increase in sunshine hours.
Climate Change Data Overview for San Jose, USA
Explore the comprehensive climate change data for San Jose, USA. This detailed table provides valuable insights into temperature variations, precipitation levels, and seasonal changes influenced by climate change, helping you understand the unique weather patterns of this region.
Temperature °C
| Month | ⌀ 1940 - 1950 | ⌀ 2013 - 2023 | +/- |
|---|---|---|---|
| Jan | 10.28 | 10.41 | 0.13 |
| Feb | 10.74 | 11.11 | 0.37 |
| Mar | 11.31 | 12.57 | 1.26 |
| Apr | 12.20 | 14.44 | 2.23 |
| May | 13.06 | 16.52 | 3.46 |
| Jun | 14.45 | 19.68 | 5.23 |
| Jul | 15.56 | 20.57 | 5.01 |
| Aug | 15.92 | 20.80 | 4.88 |
| Sep | 16.66 | 20.48 | 3.82 |
| Oct | 15.25 | 18.09 | 2.84 |
| Nov | 13.18 | 13.30 | 0.12 |
| Dec | 11.24 | 10.14 | -1.10 |
| ⌀ Month | 13.32 | 15.68 | 2.36 |
Sunshine (h)
| Month | ⌀ 1940 - 1950 | ⌀ 2013 - 2023 | +/- |
|---|---|---|---|
| Jan | 7.54 | 7.16 | -0.38 |
| Feb | 8.25 | 8.48 | 0.23 |
| Mar | 9.73 | 9.32 | -0.41 |
| Apr | 11.09 | 10.93 | -0.16 |
| May | 12.17 | 12.20 | 0.03 |
| Jun | 13.08 | 13.23 | 0.15 |
| Jul | 13.01 | 13.18 | 0.17 |
| Aug | 12.08 | 12.27 | 0.19 |
| Sep | 11.20 | 11.17 | -0.03 |
| Oct | 9.64 | 9.76 | 0.12 |
| Nov | 8.08 | 8.22 | 0.14 |
| Dec | 7.02 | 6.85 | -0.17 |
| ⌀ Month | 10.24 | 10.23 | -0.01 |
Rain (mm)
| Month | ⌀ 1940 - 1950 | ⌀ 2013 - 2023 | +/- |
|---|---|---|---|
| Jan | 4.03 | 3.24 | -0.79 |
| Feb | 5.07 | 2.77 | -2.30 |
| Mar | 3.73 | 2.79 | -0.95 |
| Apr | 1.91 | 1.04 | -0.86 |
| May | 0.73 | 0.38 | -0.35 |
| Jun | 0.12 | 0.04 | -0.07 |
| Jul | 0.02 | 0.05 | 0.04 |
| Aug | 0.01 | 0.01 | 0.00 |
| Sep | 0.03 | 0.20 | 0.17 |
| Oct | 1.16 | 0.97 | -0.19 |
| Nov | 2.69 | 1.61 | -1.08 |
| Dec | 4.09 | 3.85 | -0.24 |
| ⌀ Month | 1.96 | 1.41 | -0.55 |
Snow (mm)
| Month | ⌀ 1940 - 1950 | ⌀ 2013 - 2023 | +/- |
|---|---|---|---|
| Jan | 0.00 | 0.00 | 0.00 |
| Feb | 0.00 | 0.01 | 0.01 |
| Mar | 0.00 | 0.00 | 0.00 |
| Apr | 0.00 | 0.00 | 0.00 |
| May | 0.00 | 0.00 | 0.00 |
| Jun | 0.00 | 0.00 | 0.00 |
| Jul | 0.00 | 0.00 | 0.00 |
| Aug | 0.00 | 0.00 | 0.00 |
| Sep | 0.00 | 0.00 | 0.00 |
| Oct | 0.00 | 0.00 | 0.00 |
| Nov | 0.00 | 0.00 | 0.00 |
| Dec | 0.00 | 0.00 | -0.00 |
| ⌀ Month | 0.00 | 0.00 | 0.00 |