Climate Change Chart of Samara, Russian Federation
Comprehensive Climate Change Chart of Samara, Russian Federation: Monthly Averages and Impact Trends
Exploring the changing climate in Samara, Russian Federation reveals intriguing insights into temperature, rainfall, snowfall, and sunshine duration trends.
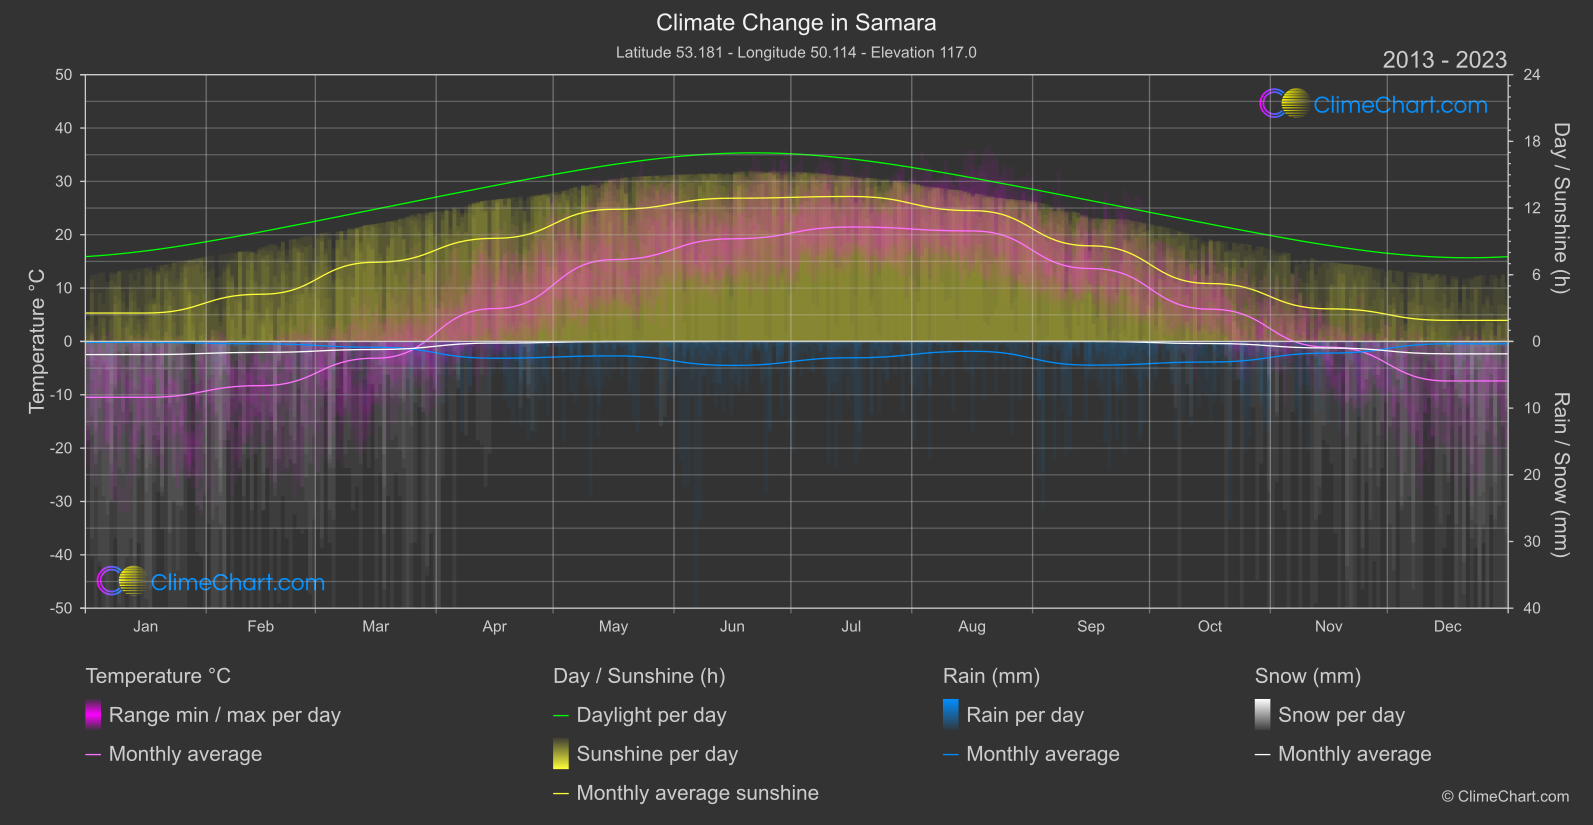
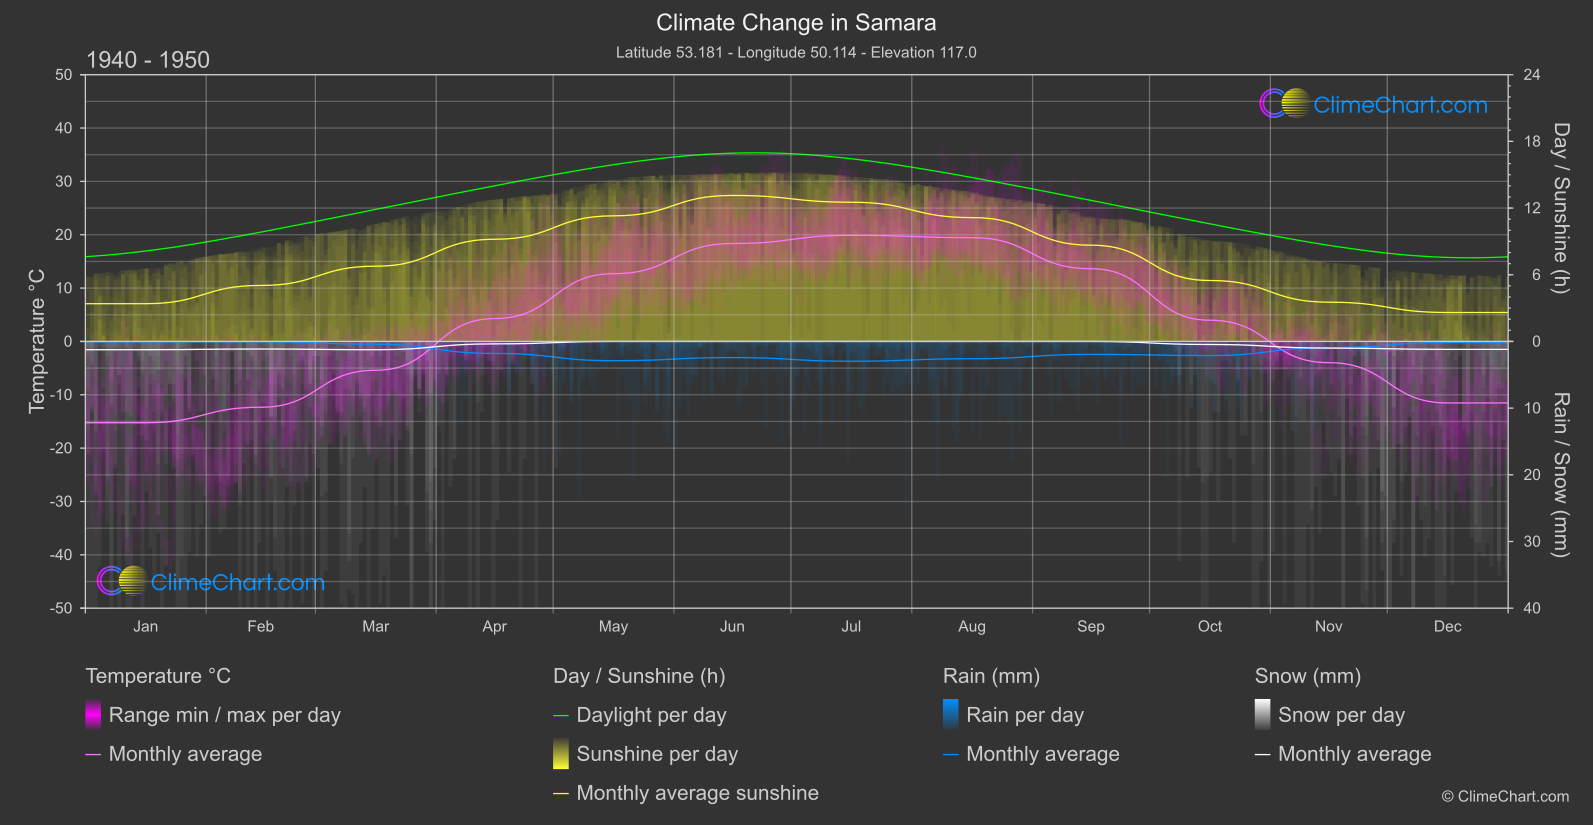
Samara, located in the Russian Federation, experiences significant changes in climate parameters such as temperature, rainfall, snowfall, and sunshine duration. The data shows variations in these factors over the years, with notable changes in specific months. For example, the month with the highest temperature change is December, while the month with the most significant rainfall change is September. Understanding these climate shifts is crucial for adapting to the evolving environmental conditions.
Climate Change Data Overview for Samara, Russian Federation
Explore the comprehensive climate change data for Samara, Russian Federation. This detailed table provides valuable insights into temperature variations, precipitation levels, and seasonal changes influenced by climate change, helping you understand the unique weather patterns of this region.
Temperature °C
| Month | ⌀ 1940 - 1950 | ⌀ 2013 - 2023 | +/- |
|---|---|---|---|
| Jan | -15.24 | -10.48 | 4.76 |
| Feb | -12.34 | -8.29 | 4.05 |
| Mar | -5.41 | -3.14 | 2.27 |
| Apr | 4.29 | 6.16 | 1.88 |
| May | 12.70 | 15.33 | 2.63 |
| Jun | 18.35 | 19.24 | 0.89 |
| Jul | 19.89 | 21.45 | 1.56 |
| Aug | 19.45 | 20.71 | 1.25 |
| Sep | 13.63 | 13.66 | 0.03 |
| Oct | 3.97 | 6.05 | 2.08 |
| Nov | -3.98 | -1.08 | 2.90 |
| Dec | -11.54 | -7.41 | 4.13 |
| ⌀ Month | 3.65 | 6.02 | 2.37 |
Sunshine (h)
| Month | ⌀ 1940 - 1950 | ⌀ 2013 - 2023 | +/- |
|---|---|---|---|
| Jan | 3.40 | 2.55 | -0.84 |
| Feb | 5.04 | 4.24 | -0.79 |
| Mar | 6.77 | 7.13 | 0.36 |
| Apr | 9.19 | 9.28 | 0.09 |
| May | 11.30 | 11.89 | 0.59 |
| Jun | 13.13 | 12.89 | -0.25 |
| Jul | 12.52 | 13.04 | 0.52 |
| Aug | 11.14 | 11.77 | 0.63 |
| Sep | 8.66 | 8.60 | -0.06 |
| Oct | 5.48 | 5.21 | -0.27 |
| Nov | 3.53 | 2.93 | -0.60 |
| Dec | 2.60 | 1.90 | -0.71 |
| ⌀ Month | 7.73 | 7.62 | -0.11 |
Rain (mm)
| Month | ⌀ 1940 - 1950 | ⌀ 2013 - 2023 | +/- |
|---|---|---|---|
| Jan | 0.03 | 0.07 | 0.04 |
| Feb | 0.03 | 0.18 | 0.15 |
| Mar | 0.21 | 0.43 | 0.23 |
| Apr | 0.90 | 1.26 | 0.36 |
| May | 1.44 | 1.08 | -0.36 |
| Jun | 1.21 | 1.80 | 0.59 |
| Jul | 1.48 | 1.23 | -0.26 |
| Aug | 1.30 | 0.74 | -0.56 |
| Sep | 0.97 | 1.78 | 0.81 |
| Oct | 1.06 | 1.54 | 0.48 |
| Nov | 0.46 | 0.87 | 0.41 |
| Dec | 0.08 | 0.18 | 0.09 |
| ⌀ Month | 0.76 | 0.93 | 0.17 |
Snow (mm)
| Month | ⌀ 1940 - 1950 | ⌀ 2013 - 2023 | +/- |
|---|---|---|---|
| Jan | 0.62 | 0.98 | 0.37 |
| Feb | 0.57 | 0.82 | 0.25 |
| Mar | 0.62 | 0.61 | -0.02 |
| Apr | 0.18 | 0.12 | -0.06 |
| May | 0.00 | 0.01 | 0.01 |
| Jun | 0.00 | 0.00 | 0.00 |
| Jul | 0.00 | 0.00 | 0.00 |
| Aug | 0.00 | 0.00 | 0.00 |
| Sep | 0.00 | 0.00 | -0.00 |
| Oct | 0.23 | 0.16 | -0.07 |
| Nov | 0.50 | 0.49 | -0.01 |
| Dec | 0.60 | 0.93 | 0.33 |
| ⌀ Month | 0.28 | 0.34 | 0.07 |