Climate Change Chart of Salzburg, Austria
Comprehensive Climate Change Chart of Salzburg, Austria: Monthly Averages and Impact Trends
Explore the changing climate in Salzburg, Austria with insightful data analysis.
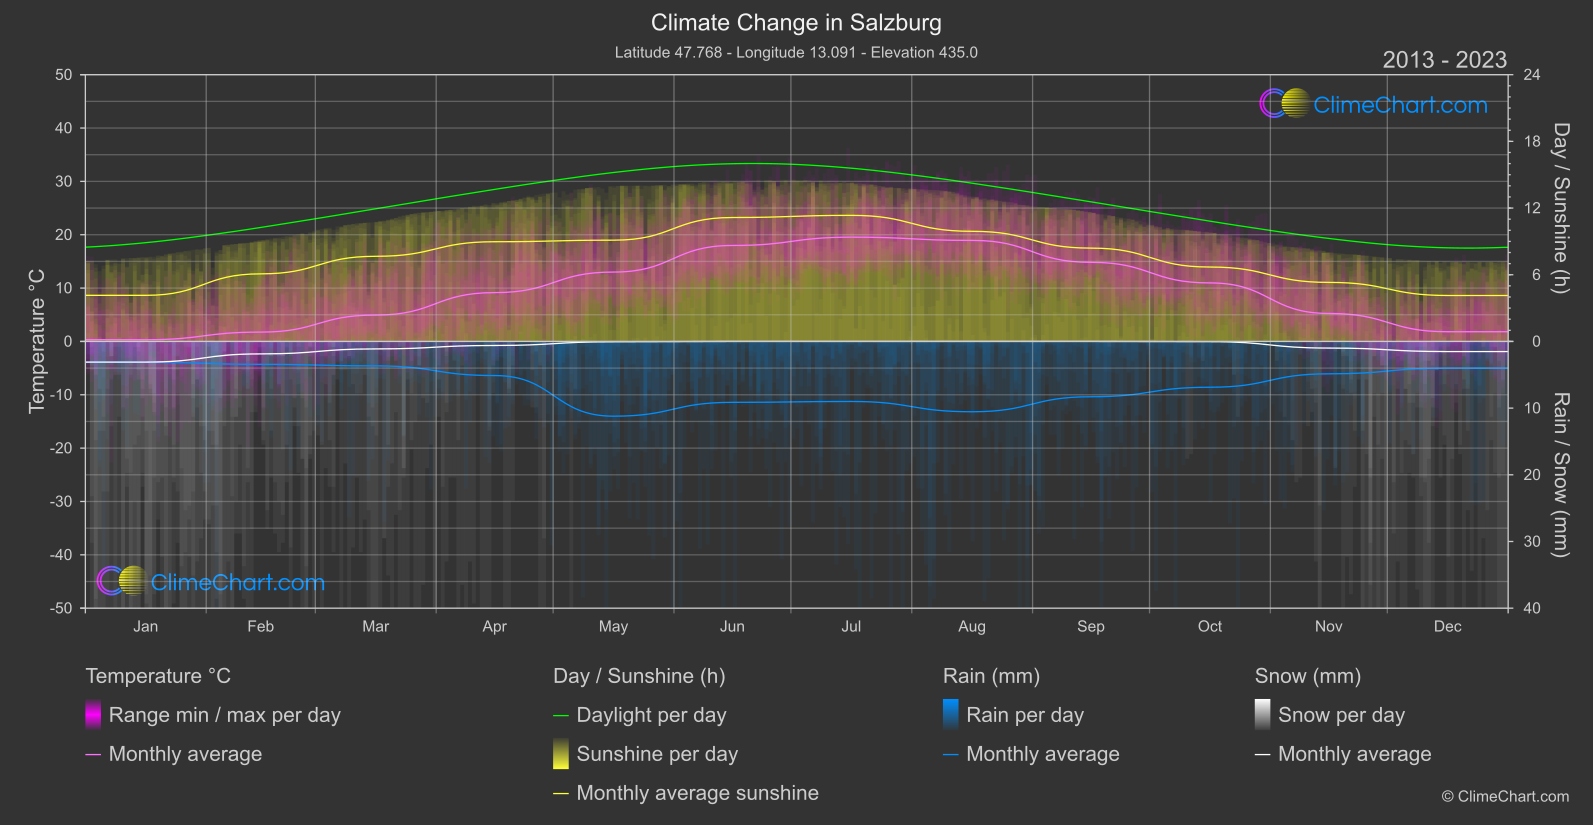
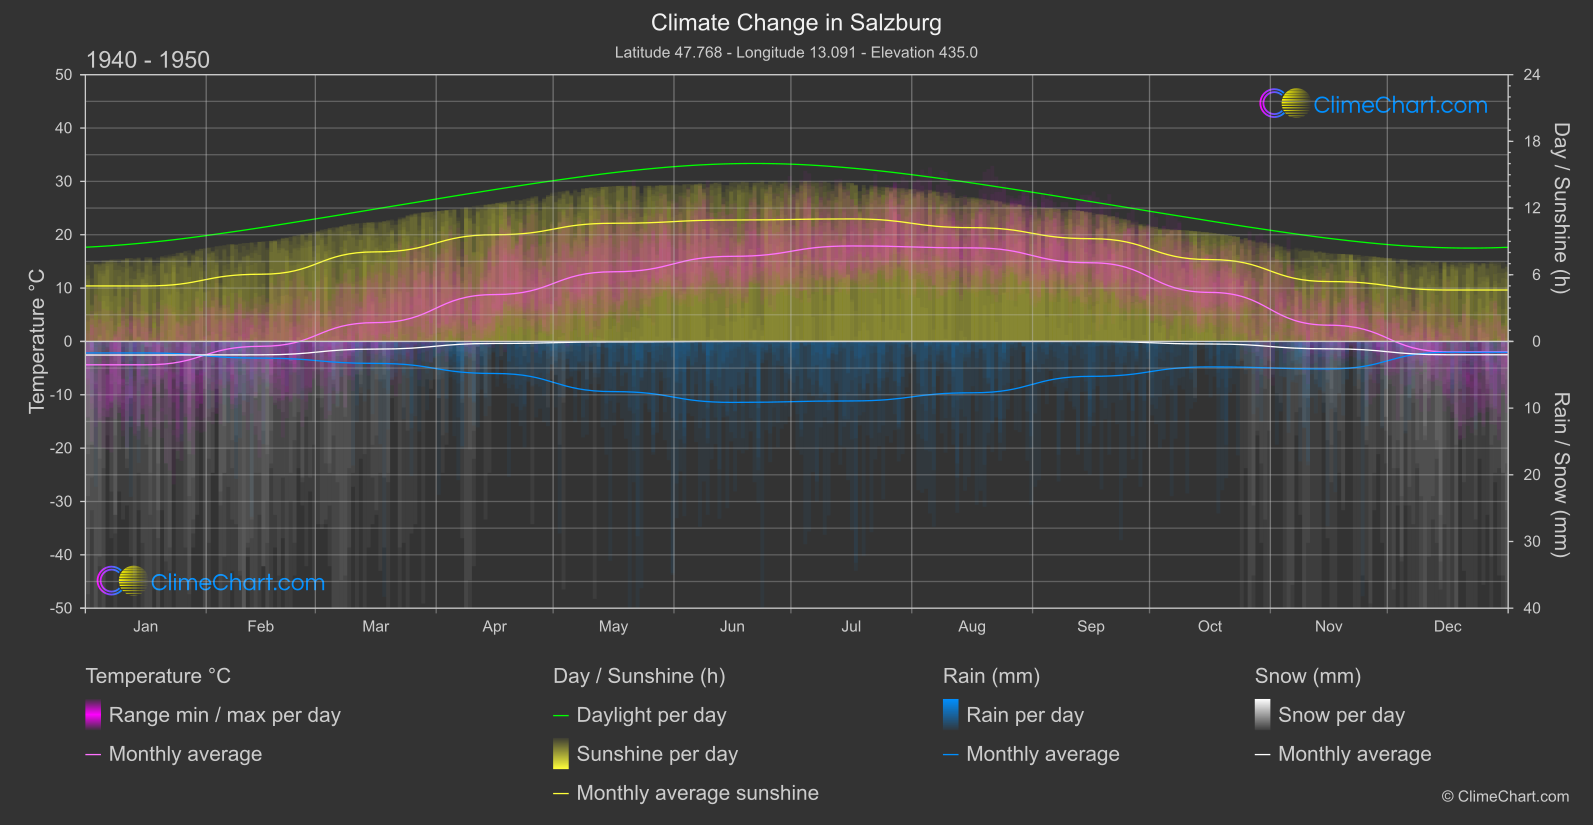
Salzburg, Austria experiences notable changes in temperature, rainfall, snowfall, and sunshine duration. In the comparison between the periods 1940 - 1950 and 2013 - 2024, the data reveals interesting insights. For example, the month with the highest temperature change is December, with a significant increase of 3.77°C. On the other hand, May shows a slight decrease in temperature by 0.05°C. As for rainfall, October has the highest increase of 1.53 mm. Snowfall has reduced significantly in December by 0.24 mm. Sunshine duration fluctuates across the months, with May experiencing the most substantial decrease of 1.52 hours.
Climate Change Data Overview for Salzburg, Austria
Explore the comprehensive climate change data for Salzburg, Austria. This detailed table provides valuable insights into temperature variations, precipitation levels, and seasonal changes influenced by climate change, helping you understand the unique weather patterns of this region.
Temperature °C
| Month | ⌀ 1940 - 1950 | ⌀ 2013 - 2023 | +/- |
|---|---|---|---|
| Jan | -4.38 | 0.32 | 4.70 |
| Feb | -0.92 | 1.75 | 2.67 |
| Mar | 3.53 | 4.94 | 1.41 |
| Apr | 8.78 | 9.15 | 0.37 |
| May | 13.06 | 13.00 | -0.05 |
| Jun | 15.95 | 17.99 | 2.03 |
| Jul | 17.89 | 19.54 | 1.65 |
| Aug | 17.54 | 18.94 | 1.40 |
| Sep | 14.74 | 14.83 | 0.09 |
| Oct | 9.19 | 10.97 | 1.78 |
| Nov | 3.05 | 5.25 | 2.20 |
| Dec | -1.95 | 1.82 | 3.77 |
| ⌀ Month | 8.04 | 9.87 | 1.83 |
Sunshine (h)
| Month | ⌀ 1940 - 1950 | ⌀ 2013 - 2023 | +/- |
|---|---|---|---|
| Jan | 4.99 | 4.15 | -0.85 |
| Feb | 6.04 | 6.08 | 0.04 |
| Mar | 8.06 | 7.66 | -0.40 |
| Apr | 9.60 | 8.97 | -0.63 |
| May | 10.63 | 9.11 | -1.52 |
| Jun | 10.93 | 11.15 | 0.22 |
| Jul | 11.02 | 11.34 | 0.32 |
| Aug | 10.24 | 9.91 | -0.33 |
| Sep | 9.24 | 8.40 | -0.85 |
| Oct | 7.36 | 6.69 | -0.67 |
| Nov | 5.39 | 5.31 | -0.08 |
| Dec | 4.63 | 4.13 | -0.49 |
| ⌀ Month | 8.18 | 7.74 | -0.44 |
Rain (mm)
| Month | ⌀ 1940 - 1950 | ⌀ 2013 - 2023 | +/- |
|---|---|---|---|
| Jan | 0.86 | 1.56 | 0.70 |
| Feb | 1.25 | 1.72 | 0.47 |
| Mar | 1.65 | 1.83 | 0.18 |
| Apr | 2.40 | 2.56 | 0.15 |
| May | 3.76 | 5.60 | 1.84 |
| Jun | 4.57 | 4.57 | -0.00 |
| Jul | 4.46 | 4.50 | 0.04 |
| Aug | 3.85 | 5.27 | 1.42 |
| Sep | 2.62 | 4.15 | 1.53 |
| Oct | 1.91 | 3.43 | 1.53 |
| Nov | 2.06 | 2.43 | 0.37 |
| Dec | 0.81 | 2.00 | 1.19 |
| ⌀ Month | 2.52 | 3.30 | 0.78 |
Snow (mm)
| Month | ⌀ 1940 - 1950 | ⌀ 2013 - 2023 | +/- |
|---|---|---|---|
| Jan | 1.02 | 1.55 | 0.53 |
| Feb | 1.00 | 0.93 | -0.07 |
| Mar | 0.57 | 0.56 | -0.01 |
| Apr | 0.15 | 0.30 | 0.15 |
| May | 0.03 | 0.03 | -0.01 |
| Jun | 0.00 | 0.00 | 0.00 |
| Jul | 0.00 | 0.00 | 0.00 |
| Aug | 0.00 | 0.00 | 0.00 |
| Sep | 0.00 | 0.00 | 0.00 |
| Oct | 0.19 | 0.02 | -0.18 |
| Nov | 0.55 | 0.50 | -0.06 |
| Dec | 1.00 | 0.76 | -0.24 |
| ⌀ Month | 0.38 | 0.39 | 0.01 |