Climate Change Chart of Saitama, Japan
Comprehensive Climate Change Chart of Saitama, Japan: Monthly Averages and Impact Trends
Explore the changing climate in Saitama, Japan, with insights from temperature, rainfall, snowfall, and sunshine duration data from 1940 to 1950 compared to 2013 to 2024.
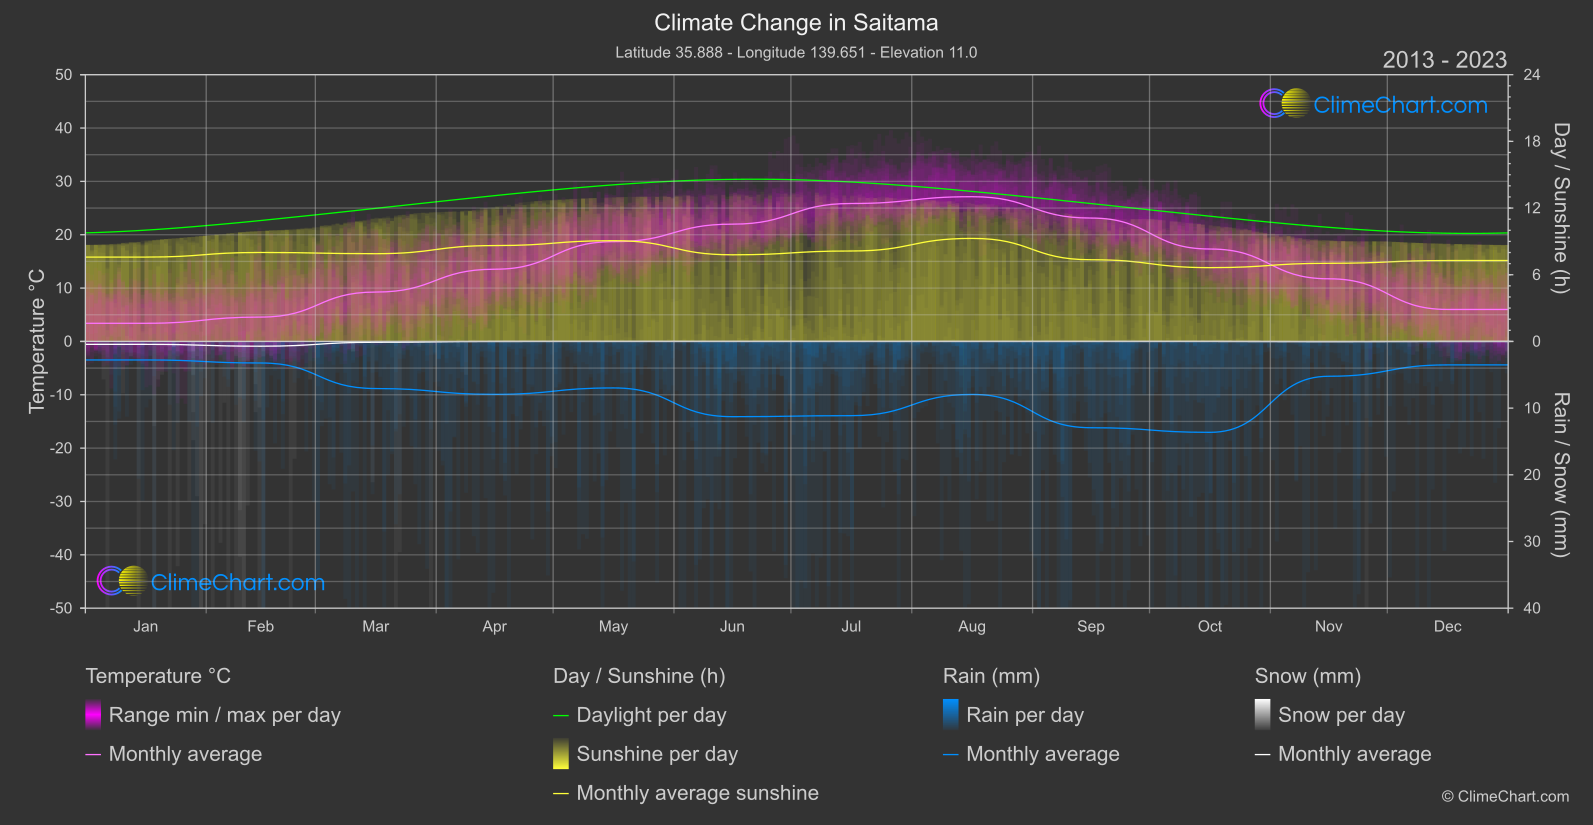
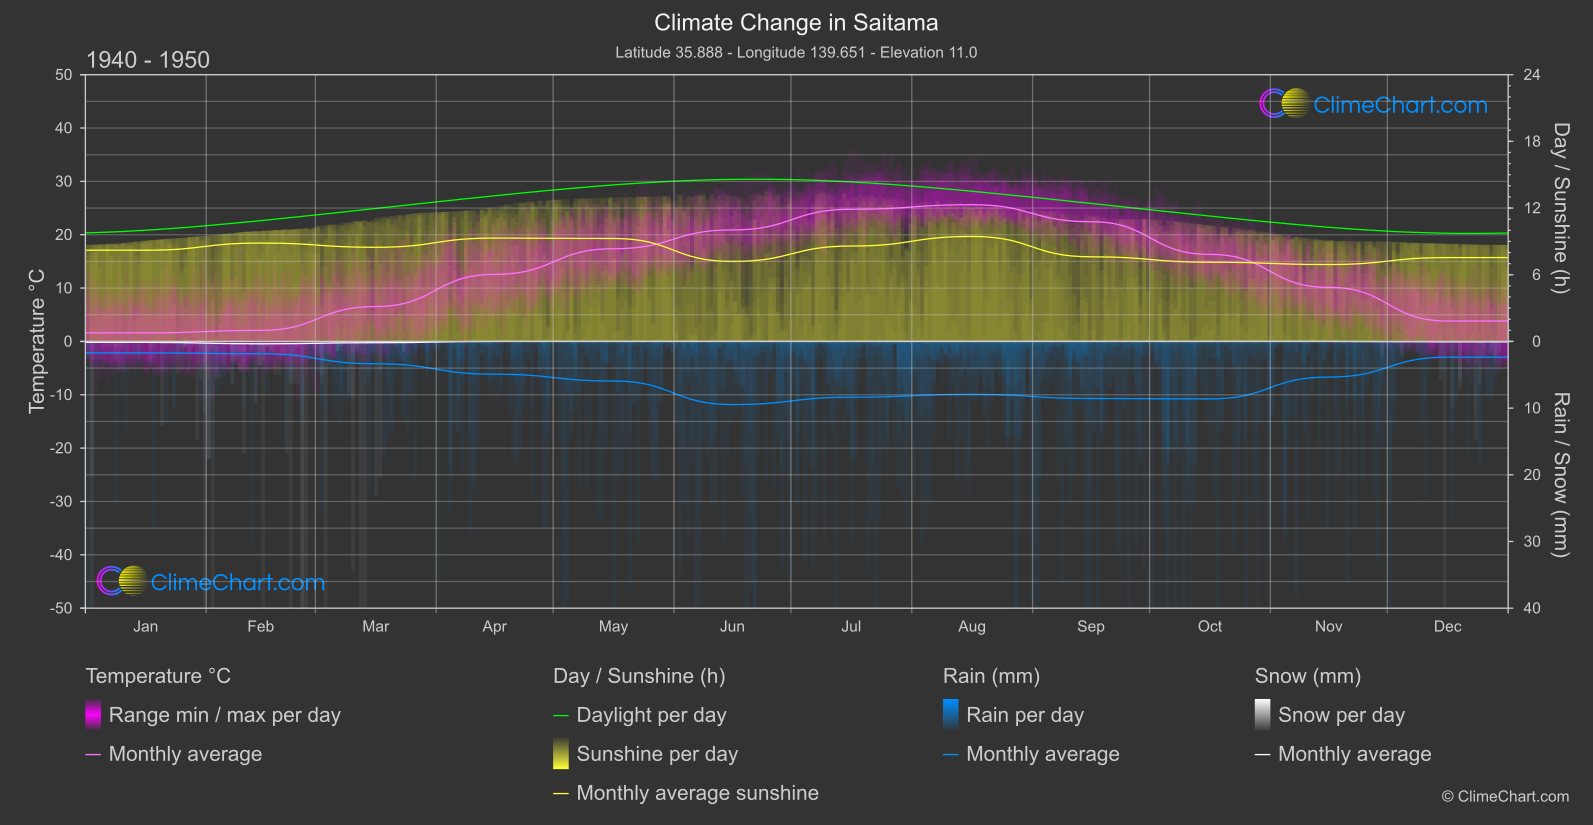
Saitama, Japan, has experienced significant climate changes over the years. From January to December, the data shows a consistent increase in temperature from 1940 to 1950 compared to 2013 to 2024. March recorded the highest temperature change of approximately 2.71°C, while December had the highest snowfall change of -0.03 mm. Rainfall increased notably in September, with a change of 2.19 mm, and sunshine duration saw fluctuations throughout the year, with the most significant change in April at -0.67 hours.
Climate Change Data Overview for Saitama, Japan
Explore the comprehensive climate change data for Saitama, Japan. This detailed table provides valuable insights into temperature variations, precipitation levels, and seasonal changes influenced by climate change, helping you understand the unique weather patterns of this region.
Temperature °C
| Month | ⌀ 1940 - 1950 | ⌀ 2013 - 2023 | +/- |
|---|---|---|---|
| Jan | 1.60 | 3.40 | 1.80 |
| Feb | 2.07 | 4.57 | 2.50 |
| Mar | 6.54 | 9.25 | 2.71 |
| Apr | 12.57 | 13.53 | 0.96 |
| May | 17.38 | 18.70 | 1.32 |
| Jun | 20.90 | 21.98 | 1.08 |
| Jul | 24.77 | 25.85 | 1.08 |
| Aug | 25.63 | 27.13 | 1.50 |
| Sep | 22.44 | 23.13 | 0.68 |
| Oct | 16.32 | 17.32 | 1.01 |
| Nov | 10.13 | 11.74 | 1.61 |
| Dec | 3.82 | 5.99 | 2.18 |
| ⌀ Month | 13.68 | 15.22 | 1.54 |
Sunshine (h)
| Month | ⌀ 1940 - 1950 | ⌀ 2013 - 2023 | +/- |
|---|---|---|---|
| Jan | 8.21 | 7.59 | -0.62 |
| Feb | 8.85 | 8.00 | -0.85 |
| Mar | 8.47 | 7.89 | -0.58 |
| Apr | 9.30 | 8.63 | -0.67 |
| May | 9.26 | 9.06 | -0.20 |
| Jun | 7.20 | 7.80 | 0.60 |
| Jul | 8.58 | 8.14 | -0.44 |
| Aug | 9.44 | 9.27 | -0.18 |
| Sep | 7.61 | 7.35 | -0.27 |
| Oct | 7.13 | 6.64 | -0.49 |
| Nov | 6.92 | 7.03 | 0.11 |
| Dec | 7.55 | 7.28 | -0.27 |
| ⌀ Month | 8.21 | 7.89 | -0.32 |
Rain (mm)
| Month | ⌀ 1940 - 1950 | ⌀ 2013 - 2023 | +/- |
|---|---|---|---|
| Jan | 0.86 | 1.39 | 0.53 |
| Feb | 0.92 | 1.62 | 0.69 |
| Mar | 1.68 | 3.53 | 1.86 |
| Apr | 2.46 | 3.97 | 1.51 |
| May | 2.97 | 3.49 | 0.52 |
| Jun | 4.73 | 5.64 | 0.91 |
| Jul | 4.18 | 5.57 | 1.38 |
| Aug | 3.97 | 3.97 | 0.01 |
| Sep | 4.28 | 6.47 | 2.19 |
| Oct | 4.31 | 6.82 | 2.50 |
| Nov | 2.67 | 2.61 | -0.06 |
| Dec | 1.18 | 1.76 | 0.58 |
| ⌀ Month | 2.85 | 3.90 | 1.05 |
Snow (mm)
| Month | ⌀ 1940 - 1950 | ⌀ 2013 - 2023 | +/- |
|---|---|---|---|
| Jan | 0.07 | 0.22 | 0.15 |
| Feb | 0.18 | 0.36 | 0.18 |
| Mar | 0.09 | 0.06 | -0.03 |
| Apr | 0.00 | 0.00 | 0.00 |
| May | 0.00 | 0.00 | 0.00 |
| Jun | 0.00 | 0.00 | 0.00 |
| Jul | 0.00 | 0.00 | 0.00 |
| Aug | 0.00 | 0.00 | 0.00 |
| Sep | 0.00 | 0.00 | 0.00 |
| Oct | 0.00 | 0.00 | 0.00 |
| Nov | 0.00 | 0.02 | 0.02 |
| Dec | 0.03 | 0.00 | -0.03 |
| ⌀ Month | 0.03 | 0.06 | 0.02 |