Climate Change Chart of Saint Petersburg, Russian Federation
Comprehensive Climate Change Chart of Saint Petersburg, Russian Federation: Monthly Averages and Impact Trends
Explore the changing climate in Saint Petersburg, Russian Federation with insightful data analysis. Discover how temperatures, rainfall, snowfall, and sunshine duration have evolved over the years.
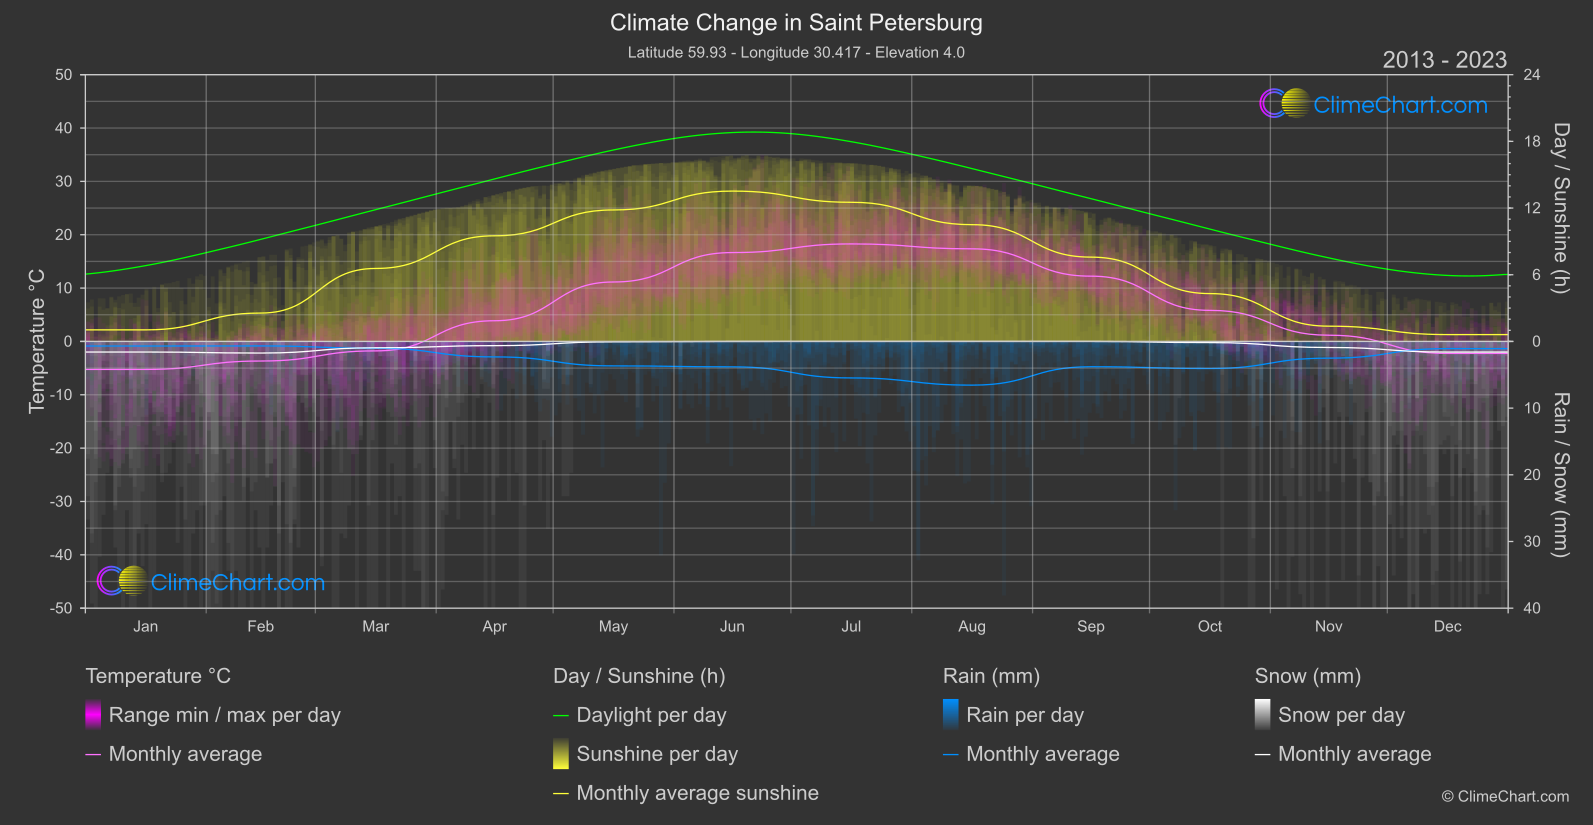
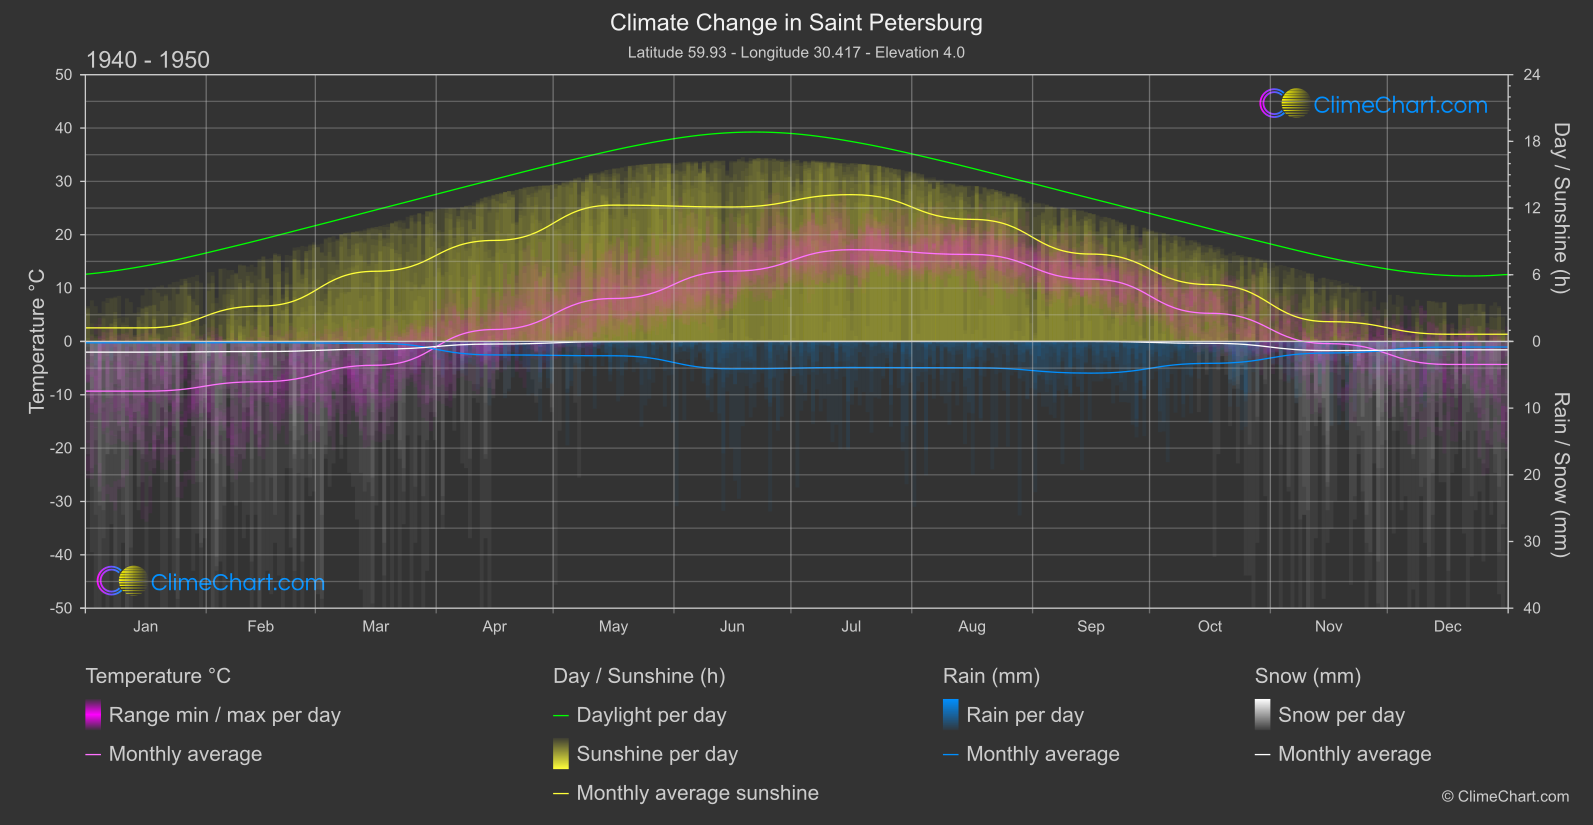
Saint Petersburg, located in the Russian Federation, has experienced significant changes in climate indicators over the years. From temperature fluctuations to variations in rainfall, snowfall, and sunshine duration, the data provides valuable insights into the evolving weather patterns. Analyzing the data reveals interesting trends, such as the month with the highest temperature change or rainfall variance. Stay informed about the climate shifts affecting Saint Petersburg and understand the impacts of these changes on the region.
Climate Change Data Overview for Saint Petersburg, Russian Federation
Explore the comprehensive climate change data for Saint Petersburg, Russian Federation. This detailed table provides valuable insights into temperature variations, precipitation levels, and seasonal changes influenced by climate change, helping you understand the unique weather patterns of this region.
Temperature °C
| Month | ⌀ 1940 - 1950 | ⌀ 2013 - 2023 | +/- |
|---|---|---|---|
| Jan | -9.32 | -5.25 | 4.07 |
| Feb | -7.55 | -3.67 | 3.87 |
| Mar | -4.46 | -1.77 | 2.69 |
| Apr | 2.24 | 3.88 | 1.64 |
| May | 8.05 | 11.14 | 3.09 |
| Jun | 13.18 | 16.66 | 3.48 |
| Jul | 17.19 | 18.28 | 1.09 |
| Aug | 16.30 | 17.36 | 1.06 |
| Sep | 11.67 | 12.23 | 0.56 |
| Oct | 5.27 | 5.82 | 0.55 |
| Nov | -0.41 | 1.17 | 1.58 |
| Dec | -4.31 | -2.25 | 2.06 |
| ⌀ Month | 3.99 | 6.13 | 2.15 |
Sunshine (h)
| Month | ⌀ 1940 - 1950 | ⌀ 2013 - 2023 | +/- |
|---|---|---|---|
| Jan | 1.22 | 1.04 | -0.18 |
| Feb | 3.18 | 2.55 | -0.63 |
| Mar | 6.31 | 6.57 | 0.25 |
| Apr | 9.09 | 9.50 | 0.42 |
| May | 12.26 | 11.83 | -0.43 |
| Jun | 12.10 | 13.53 | 1.43 |
| Jul | 13.21 | 12.52 | -0.69 |
| Aug | 10.98 | 10.51 | -0.48 |
| Sep | 7.86 | 7.58 | -0.28 |
| Oct | 5.11 | 4.30 | -0.81 |
| Nov | 1.78 | 1.37 | -0.41 |
| Dec | 0.65 | 0.62 | -0.03 |
| ⌀ Month | 6.98 | 6.83 | -0.15 |
Rain (mm)
| Month | ⌀ 1940 - 1950 | ⌀ 2013 - 2023 | +/- |
|---|---|---|---|
| Jan | 0.10 | 0.35 | 0.24 |
| Feb | 0.09 | 0.34 | 0.24 |
| Mar | 0.14 | 0.51 | 0.37 |
| Apr | 1.01 | 1.16 | 0.15 |
| May | 1.07 | 1.83 | 0.76 |
| Jun | 2.05 | 1.91 | -0.15 |
| Jul | 1.95 | 2.74 | 0.79 |
| Aug | 1.98 | 3.28 | 1.30 |
| Sep | 2.38 | 1.90 | -0.48 |
| Oct | 1.64 | 2.03 | 0.39 |
| Nov | 0.87 | 1.25 | 0.39 |
| Dec | 0.42 | 0.54 | 0.12 |
| ⌀ Month | 1.14 | 1.49 | 0.34 |
Snow (mm)
| Month | ⌀ 1940 - 1950 | ⌀ 2013 - 2023 | +/- |
|---|---|---|---|
| Jan | 0.80 | 0.79 | -0.01 |
| Feb | 0.76 | 0.87 | 0.11 |
| Mar | 0.58 | 0.48 | -0.10 |
| Apr | 0.19 | 0.32 | 0.12 |
| May | 0.02 | 0.03 | 0.02 |
| Jun | 0.00 | 0.00 | 0.00 |
| Jul | 0.00 | 0.00 | 0.00 |
| Aug | 0.00 | 0.00 | 0.00 |
| Sep | 0.00 | 0.00 | 0.00 |
| Oct | 0.14 | 0.09 | -0.05 |
| Nov | 0.69 | 0.45 | -0.23 |
| Dec | 0.63 | 0.80 | 0.17 |
| ⌀ Month | 0.32 | 0.32 | 0.00 |