Climate Change Chart of Saint Paul, USA
Comprehensive Climate Change Chart of Saint Paul, USA: Monthly Averages and Impact Trends
Explore the changing climate in Saint Paul, USA with insightful data analysis.
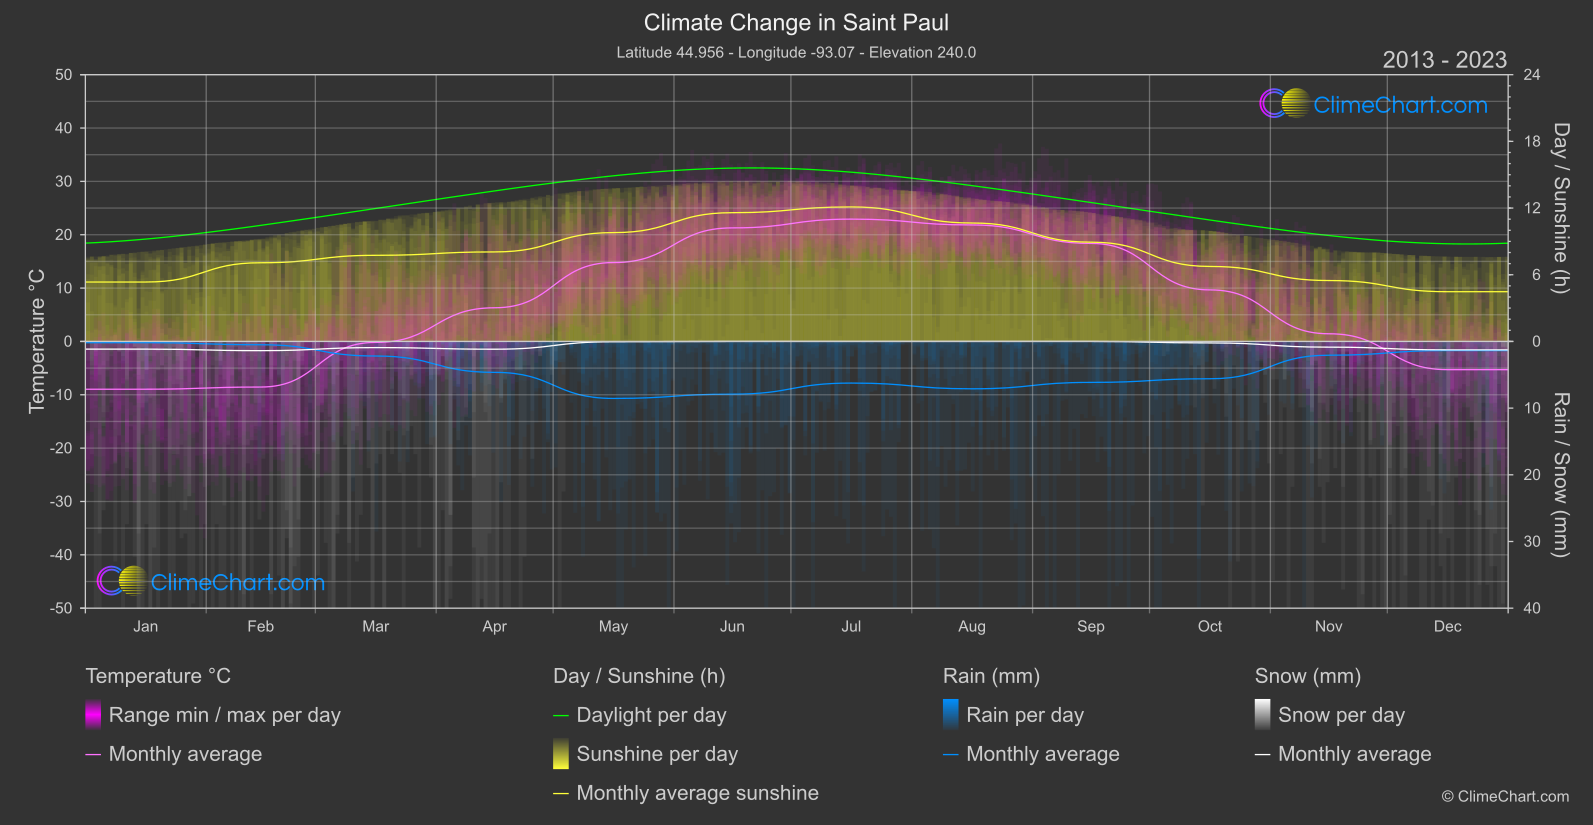
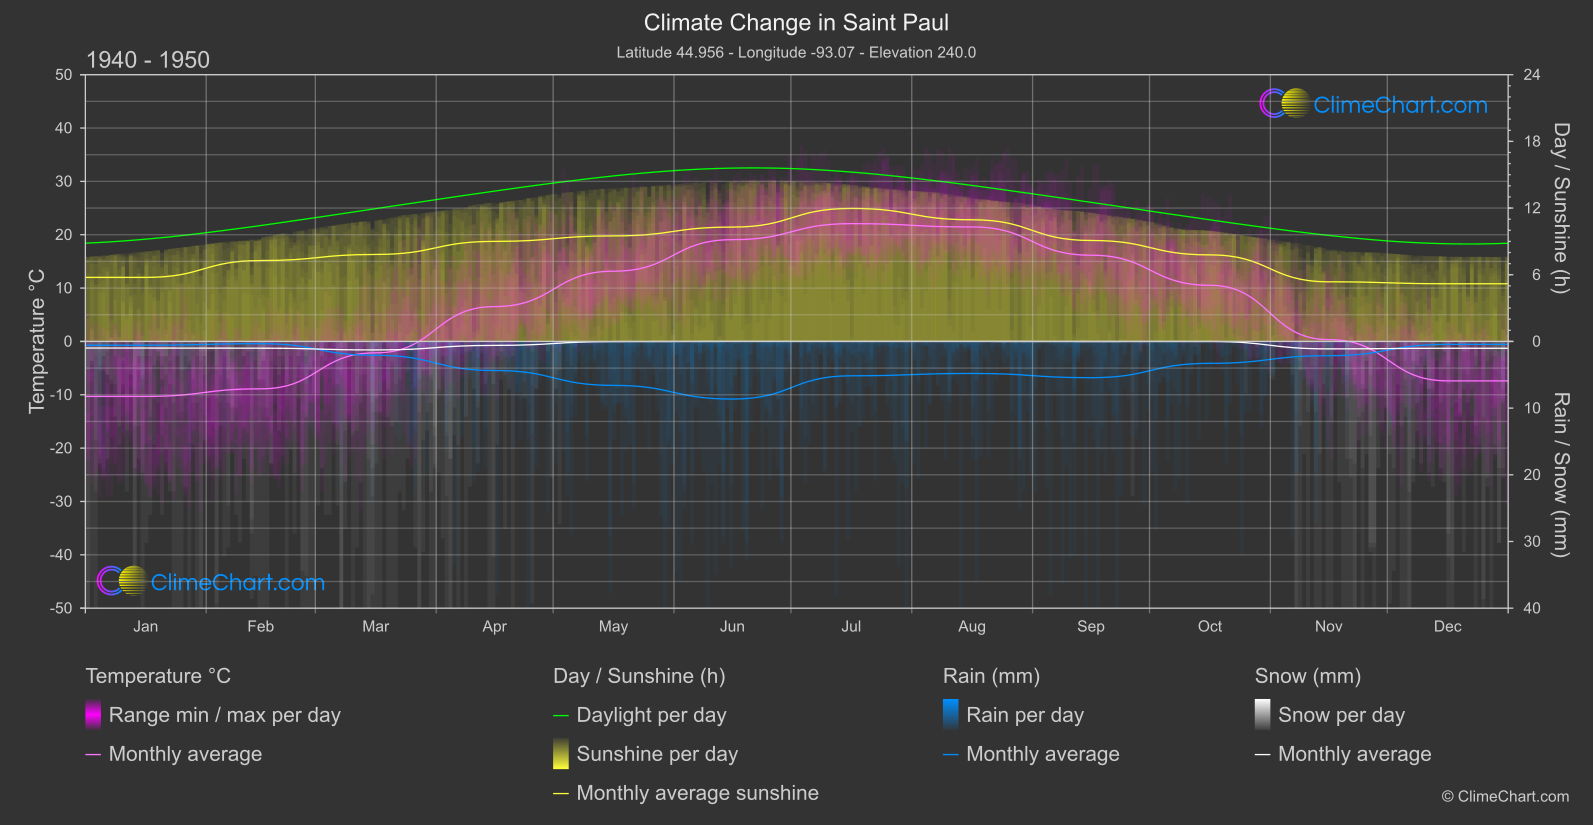
Saint Paul, located in the USA, has experienced notable shifts in temperature, rainfall, snowfall, and sunshine duration over the years. Analyzing data from 1940 to 1950 and comparing it to 2013-2024 reveals interesting insights. In terms of temperature, June witnessed a substantial increase of 2.21°C, while December had a significant rise of 2.10°C. Rainfall patterns also changed, with October experiencing a notable increase of 1.16mm. Snowfall showed variations, with April having a significant rise of 0.29mm. Sunshine duration had fluctuations, notably with June showing a notable increase of 1.30 hours. Understanding these changes is crucial for climate resilience and adaptation in Saint Paul.
Climate Change Data Overview for Saint Paul, USA
Explore the comprehensive climate change data for Saint Paul, USA. This detailed table provides valuable insights into temperature variations, precipitation levels, and seasonal changes influenced by climate change, helping you understand the unique weather patterns of this region.
Temperature °C
| Month | ⌀ 1940 - 1950 | ⌀ 2013 - 2023 | +/- |
|---|---|---|---|
| Jan | -10.30 | -8.96 | 1.35 |
| Feb | -8.88 | -8.55 | 0.34 |
| Mar | -2.14 | -0.18 | 1.96 |
| Apr | 6.53 | 6.31 | -0.22 |
| May | 13.17 | 14.78 | 1.62 |
| Jun | 19.07 | 21.28 | 2.21 |
| Jul | 22.08 | 22.93 | 0.85 |
| Aug | 21.46 | 21.83 | 0.38 |
| Sep | 16.16 | 18.37 | 2.21 |
| Oct | 10.52 | 9.66 | -0.86 |
| Nov | 0.34 | 1.44 | 1.10 |
| Dec | -7.39 | -5.29 | 2.10 |
| ⌀ Month | 6.72 | 7.80 | 1.08 |
Sunshine (h)
| Month | ⌀ 1940 - 1950 | ⌀ 2013 - 2023 | +/- |
|---|---|---|---|
| Jan | 5.76 | 5.35 | -0.42 |
| Feb | 7.28 | 7.08 | -0.20 |
| Mar | 7.83 | 7.75 | -0.08 |
| Apr | 9.00 | 8.05 | -0.95 |
| May | 9.50 | 9.79 | 0.30 |
| Jun | 10.29 | 11.58 | 1.30 |
| Jul | 11.97 | 12.10 | 0.13 |
| Aug | 10.94 | 10.65 | -0.29 |
| Sep | 9.08 | 8.93 | -0.15 |
| Oct | 7.79 | 6.75 | -1.04 |
| Nov | 5.36 | 5.48 | 0.12 |
| Dec | 5.19 | 4.47 | -0.71 |
| ⌀ Month | 8.33 | 8.17 | -0.17 |
Rain (mm)
| Month | ⌀ 1940 - 1950 | ⌀ 2013 - 2023 | +/- |
|---|---|---|---|
| Jan | 0.29 | 0.09 | -0.19 |
| Feb | 0.17 | 0.25 | 0.08 |
| Mar | 1.04 | 1.09 | 0.05 |
| Apr | 2.18 | 2.32 | 0.14 |
| May | 3.30 | 4.27 | 0.98 |
| Jun | 4.32 | 3.95 | -0.37 |
| Jul | 2.58 | 3.12 | 0.55 |
| Aug | 2.40 | 3.55 | 1.15 |
| Sep | 2.72 | 3.07 | 0.35 |
| Oct | 1.64 | 2.80 | 1.16 |
| Nov | 1.07 | 1.03 | -0.03 |
| Dec | 0.22 | 0.68 | 0.46 |
| ⌀ Month | 1.83 | 2.19 | 0.36 |
Snow (mm)
| Month | ⌀ 1940 - 1950 | ⌀ 2013 - 2023 | +/- |
|---|---|---|---|
| Jan | 0.50 | 0.58 | 0.08 |
| Feb | 0.51 | 0.69 | 0.19 |
| Mar | 0.64 | 0.46 | -0.18 |
| Apr | 0.30 | 0.58 | 0.29 |
| May | 0.01 | 0.02 | 0.01 |
| Jun | 0.00 | 0.00 | 0.00 |
| Jul | 0.00 | 0.00 | 0.00 |
| Aug | 0.00 | 0.00 | 0.00 |
| Sep | 0.01 | 0.00 | -0.01 |
| Oct | 0.00 | 0.11 | 0.11 |
| Nov | 0.56 | 0.43 | -0.13 |
| Dec | 0.51 | 0.63 | 0.12 |
| ⌀ Month | 0.25 | 0.29 | 0.04 |