Climate Change Chart of Runaway Bay, Jamaica
Comprehensive Climate Change Chart of Runaway Bay, Jamaica: Monthly Averages and Impact Trends
Explore the changing climate patterns in Runaway Bay, Jamaica, through insightful data analysis.
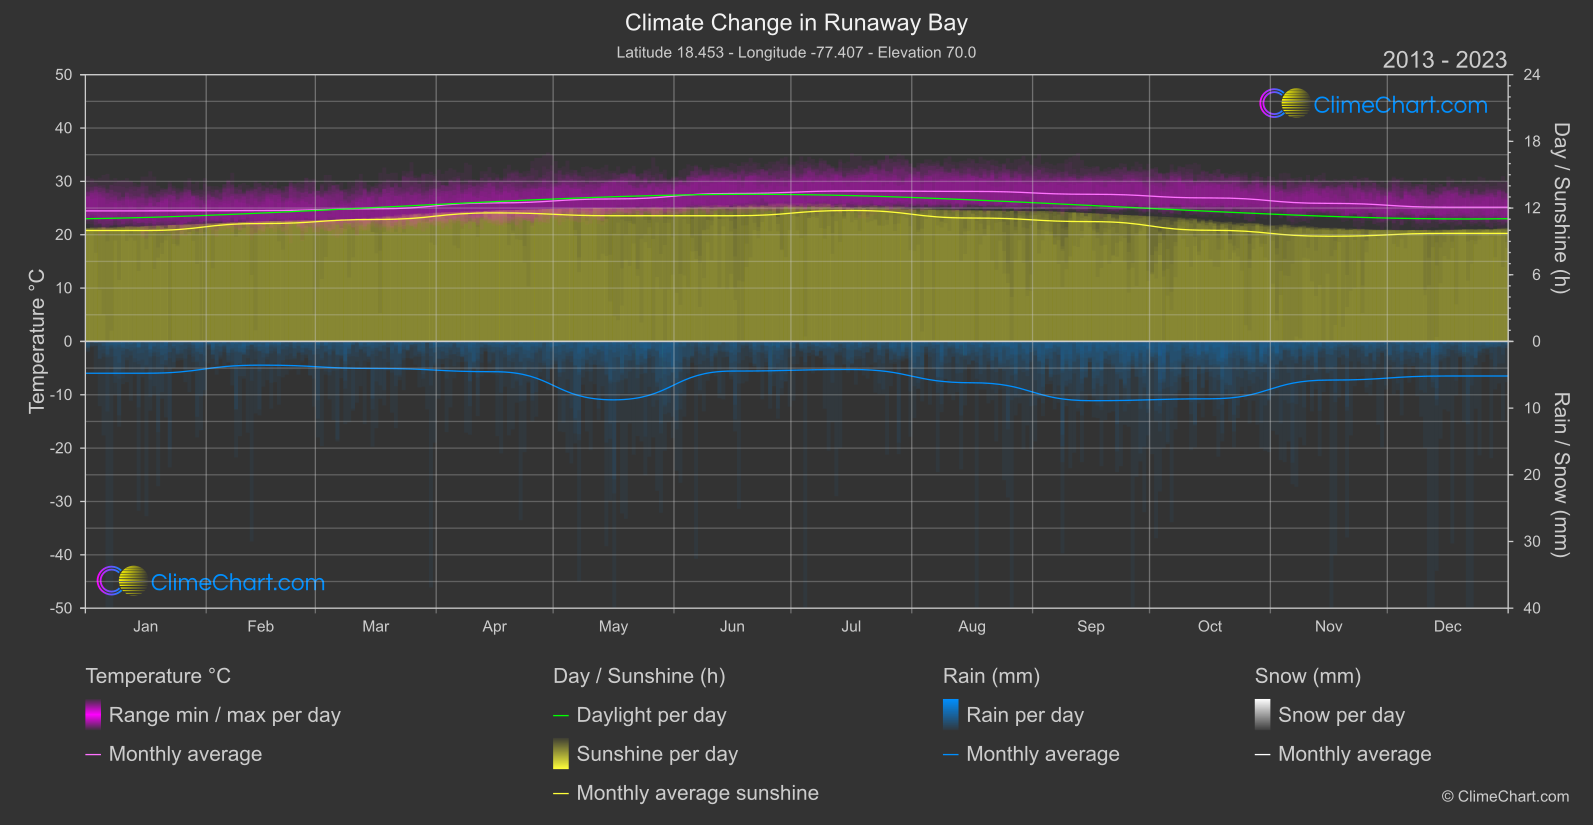
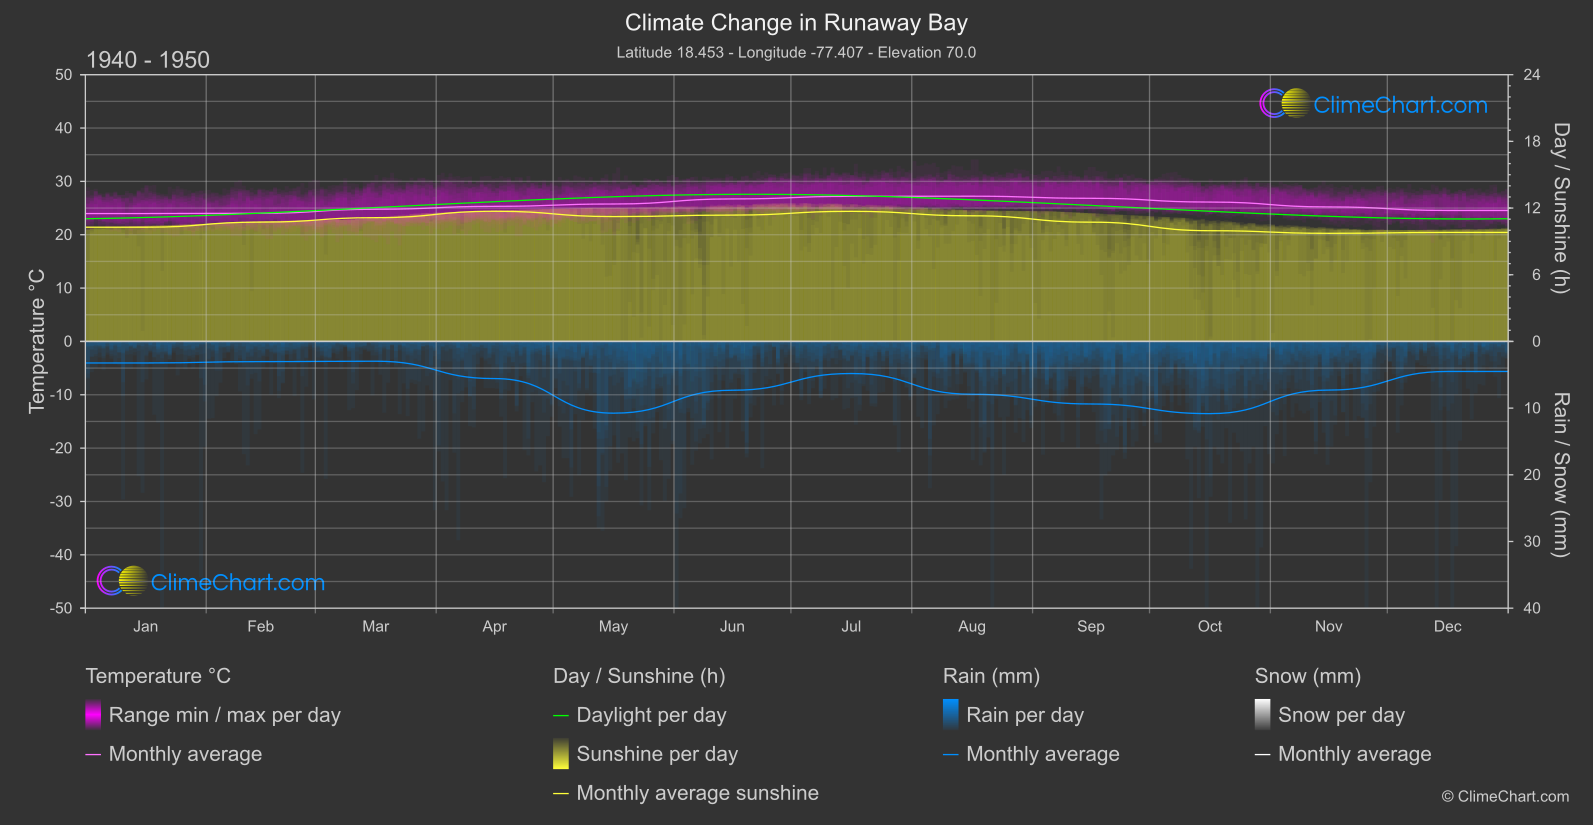
Runaway Bay, Jamaica, has experienced temperature shifts and rainfall variations over the years. Analyzing the data from the 1940s to the 1950s compared to 2013-2024 reveals interesting insights. In terms of temperature, June shows the highest increase of approximately 1.02°C, while for rainfall, May experiences the most significant decrease of around 1.00 mm. Additionally, the sunshine duration in July sees a notable rise compared to the past.
Climate Change Data Overview for Runaway Bay, Jamaica
Explore the comprehensive climate change data for Runaway Bay, Jamaica. This detailed table provides valuable insights into temperature variations, precipitation levels, and seasonal changes influenced by climate change, helping you understand the unique weather patterns of this region.
Temperature °C
| Month | ⌀ 1940 - 1950 | ⌀ 2013 - 2023 | +/- |
|---|---|---|---|
| Jan | 23.97 | 24.47 | 0.50 |
| Feb | 24.02 | 24.53 | 0.51 |
| Mar | 24.77 | 24.86 | 0.08 |
| Apr | 25.32 | 25.97 | 0.65 |
| May | 25.76 | 26.71 | 0.95 |
| Jun | 26.71 | 27.73 | 1.02 |
| Jul | 27.20 | 28.20 | 1.00 |
| Aug | 27.22 | 28.12 | 0.90 |
| Sep | 26.83 | 27.58 | 0.75 |
| Oct | 26.12 | 26.90 | 0.78 |
| Nov | 25.21 | 25.88 | 0.66 |
| Dec | 24.55 | 25.16 | 0.61 |
| ⌀ Month | 25.64 | 26.34 | 0.70 |
Sunshine (h)
| Month | ⌀ 1940 - 1950 | ⌀ 2013 - 2023 | +/- |
|---|---|---|---|
| Jan | 10.28 | 9.98 | -0.30 |
| Feb | 10.73 | 10.60 | -0.13 |
| Mar | 11.14 | 10.97 | -0.16 |
| Apr | 11.71 | 11.56 | -0.15 |
| May | 11.23 | 11.31 | 0.08 |
| Jun | 11.37 | 11.31 | -0.06 |
| Jul | 11.71 | 11.78 | 0.08 |
| Aug | 11.30 | 11.10 | -0.20 |
| Sep | 10.73 | 10.78 | 0.05 |
| Oct | 9.96 | 10.00 | 0.04 |
| Nov | 9.73 | 9.47 | -0.26 |
| Dec | 9.81 | 9.72 | -0.08 |
| ⌀ Month | 10.81 | 10.72 | -0.09 |
Rain (mm)
| Month | ⌀ 1940 - 1950 | ⌀ 2013 - 2023 | +/- |
|---|---|---|---|
| Jan | 1.61 | 2.38 | 0.77 |
| Feb | 1.51 | 1.78 | 0.26 |
| Mar | 1.48 | 2.03 | 0.54 |
| Apr | 2.79 | 2.27 | -0.51 |
| May | 5.38 | 4.38 | -1.00 |
| Jun | 3.66 | 2.22 | -1.44 |
| Jul | 2.41 | 2.10 | -0.30 |
| Aug | 3.96 | 3.10 | -0.86 |
| Sep | 4.69 | 4.44 | -0.25 |
| Oct | 5.41 | 4.30 | -1.11 |
| Nov | 3.65 | 2.90 | -0.75 |
| Dec | 2.25 | 2.59 | 0.34 |
| ⌀ Month | 3.23 | 2.87 | -0.36 |
Snow (mm)
| Month | ⌀ 1940 - 1950 | ⌀ 2013 - 2023 | +/- |
|---|---|---|---|
| Jan | 0.00 | 0.00 | 0.00 |
| Feb | 0.00 | 0.00 | 0.00 |
| Mar | 0.00 | 0.00 | 0.00 |
| Apr | 0.00 | 0.00 | 0.00 |
| May | 0.00 | 0.00 | 0.00 |
| Jun | 0.00 | 0.00 | 0.00 |
| Jul | 0.00 | 0.00 | 0.00 |
| Aug | 0.00 | 0.00 | 0.00 |
| Sep | 0.00 | 0.00 | 0.00 |
| Oct | 0.00 | 0.00 | 0.00 |
| Nov | 0.00 | 0.00 | 0.00 |
| Dec | 0.00 | 0.00 | 0.00 |
| ⌀ Month | 0.00 | 0.00 | 0.00 |