Climate Change Chart of Rome, Italy
Comprehensive Climate Change Chart of Rome, Italy: Monthly Averages and Impact Trends
Exploring the climate change in Rome, Italy reveals intriguing insights into temperature, rainfall, snowfall, and sunshine duration over the years.
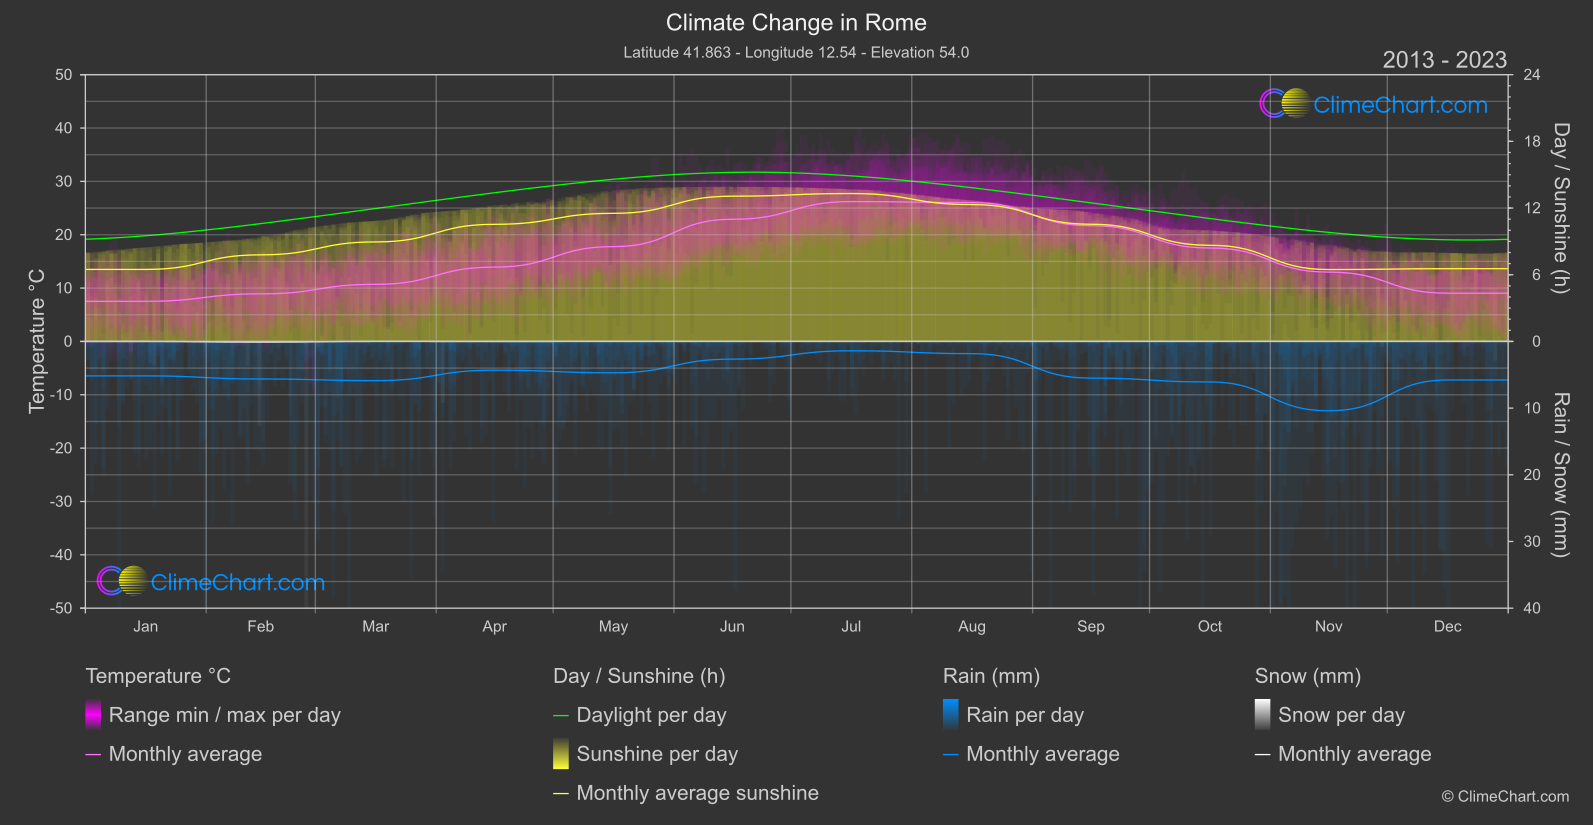
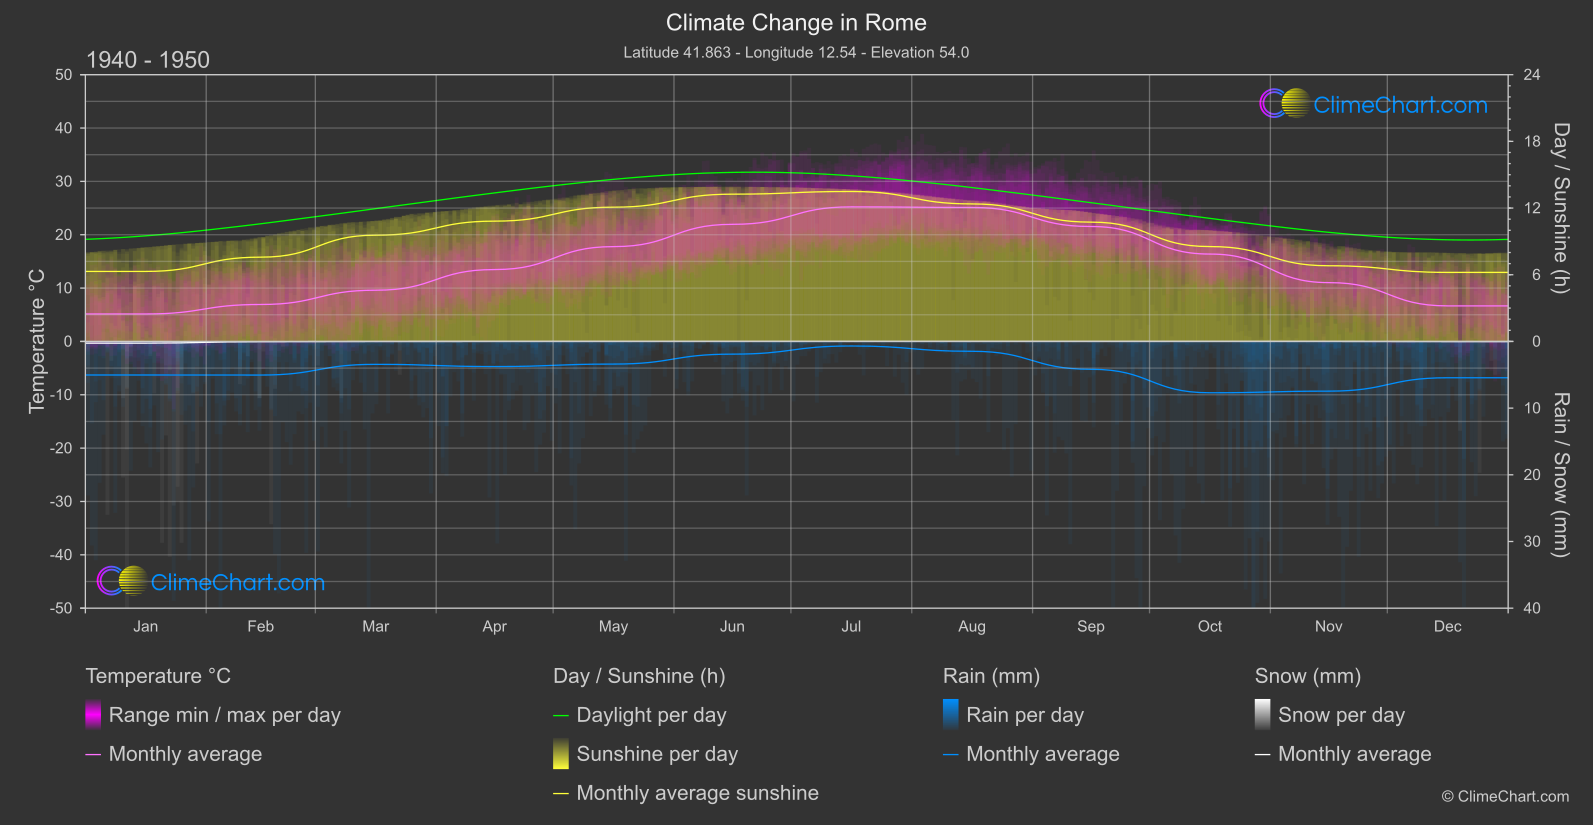
Rome, the capital city of Italy, experiences notable changes in temperature, with the highest temperature increase observed in December. The data also shows a significant rise in rainfall from November to April, indicating a shift in precipitation patterns. Interestingly, there is a minimal change in snowfall over the years, suggesting a stable snowfall trend. Additionally, the sunshine duration shows fluctuations, with the most notable decrease in sunshine hours occurring in March. These insights provide valuable information on the evolving climate patterns in Rome, Italy.
Climate Change Data Overview for Rome, Italy
Explore the comprehensive climate change data for Rome, Italy. This detailed table provides valuable insights into temperature variations, precipitation levels, and seasonal changes influenced by climate change, helping you understand the unique weather patterns of this region.
Temperature °C
| Month | ⌀ 1940 - 1950 | ⌀ 2013 - 2023 | +/- |
|---|---|---|---|
| Jan | 5.15 | 7.52 | 2.37 |
| Feb | 6.93 | 8.91 | 1.99 |
| Mar | 9.60 | 10.70 | 1.10 |
| Apr | 13.47 | 13.93 | 0.46 |
| May | 17.77 | 17.78 | 0.00 |
| Jun | 21.95 | 22.89 | 0.94 |
| Jul | 25.22 | 26.21 | 0.99 |
| Aug | 25.11 | 26.03 | 0.92 |
| Sep | 21.54 | 21.70 | 0.15 |
| Oct | 16.38 | 17.51 | 1.14 |
| Nov | 11.02 | 12.99 | 1.97 |
| Dec | 6.66 | 9.04 | 2.37 |
| ⌀ Month | 15.07 | 16.27 | 1.20 |
Sunshine (h)
| Month | ⌀ 1940 - 1950 | ⌀ 2013 - 2023 | +/- |
|---|---|---|---|
| Jan | 6.30 | 6.48 | 0.18 |
| Feb | 7.58 | 7.79 | 0.21 |
| Mar | 9.56 | 8.95 | -0.61 |
| Apr | 10.82 | 10.54 | -0.29 |
| May | 12.08 | 11.53 | -0.55 |
| Jun | 13.25 | 13.07 | -0.18 |
| Jul | 13.49 | 13.31 | -0.18 |
| Aug | 12.37 | 12.31 | -0.06 |
| Sep | 10.73 | 10.54 | -0.19 |
| Oct | 8.54 | 8.65 | 0.12 |
| Nov | 6.81 | 6.47 | -0.34 |
| Dec | 6.21 | 6.54 | 0.33 |
| ⌀ Month | 9.81 | 9.68 | -0.13 |
Rain (mm)
| Month | ⌀ 1940 - 1950 | ⌀ 2013 - 2023 | +/- |
|---|---|---|---|
| Jan | 2.52 | 2.58 | 0.07 |
| Feb | 2.52 | 2.82 | 0.29 |
| Mar | 1.72 | 2.94 | 1.22 |
| Apr | 1.88 | 2.16 | 0.27 |
| May | 1.70 | 2.35 | 0.66 |
| Jun | 0.95 | 1.33 | 0.37 |
| Jul | 0.34 | 0.70 | 0.36 |
| Aug | 0.74 | 0.92 | 0.18 |
| Sep | 2.09 | 2.75 | 0.66 |
| Oct | 3.85 | 3.04 | -0.81 |
| Nov | 3.73 | 5.20 | 1.47 |
| Dec | 2.72 | 2.89 | 0.17 |
| ⌀ Month | 2.06 | 2.47 | 0.41 |
Snow (mm)
| Month | ⌀ 1940 - 1950 | ⌀ 2013 - 2023 | +/- |
|---|---|---|---|
| Jan | 0.13 | 0.00 | -0.12 |
| Feb | 0.02 | 0.05 | 0.03 |
| Mar | 0.00 | 0.00 | -0.00 |
| Apr | 0.00 | 0.00 | 0.00 |
| May | 0.00 | 0.00 | 0.00 |
| Jun | 0.00 | 0.00 | 0.00 |
| Jul | 0.00 | 0.00 | 0.00 |
| Aug | 0.00 | 0.00 | 0.00 |
| Sep | 0.00 | 0.00 | 0.00 |
| Oct | 0.00 | 0.00 | 0.00 |
| Nov | 0.00 | 0.00 | 0.00 |
| Dec | 0.01 | 0.00 | -0.01 |
| ⌀ Month | 0.01 | 0.00 | -0.01 |