Climate Change Chart of Roatan, Honduras
Comprehensive Climate Change Chart of Roatan, Honduras: Monthly Averages and Impact Trends
Explore the changing climate in Roatan, Honduras with insightful data analysis. Discover how temperature, rainfall, and sunshine duration have evolved over the years.
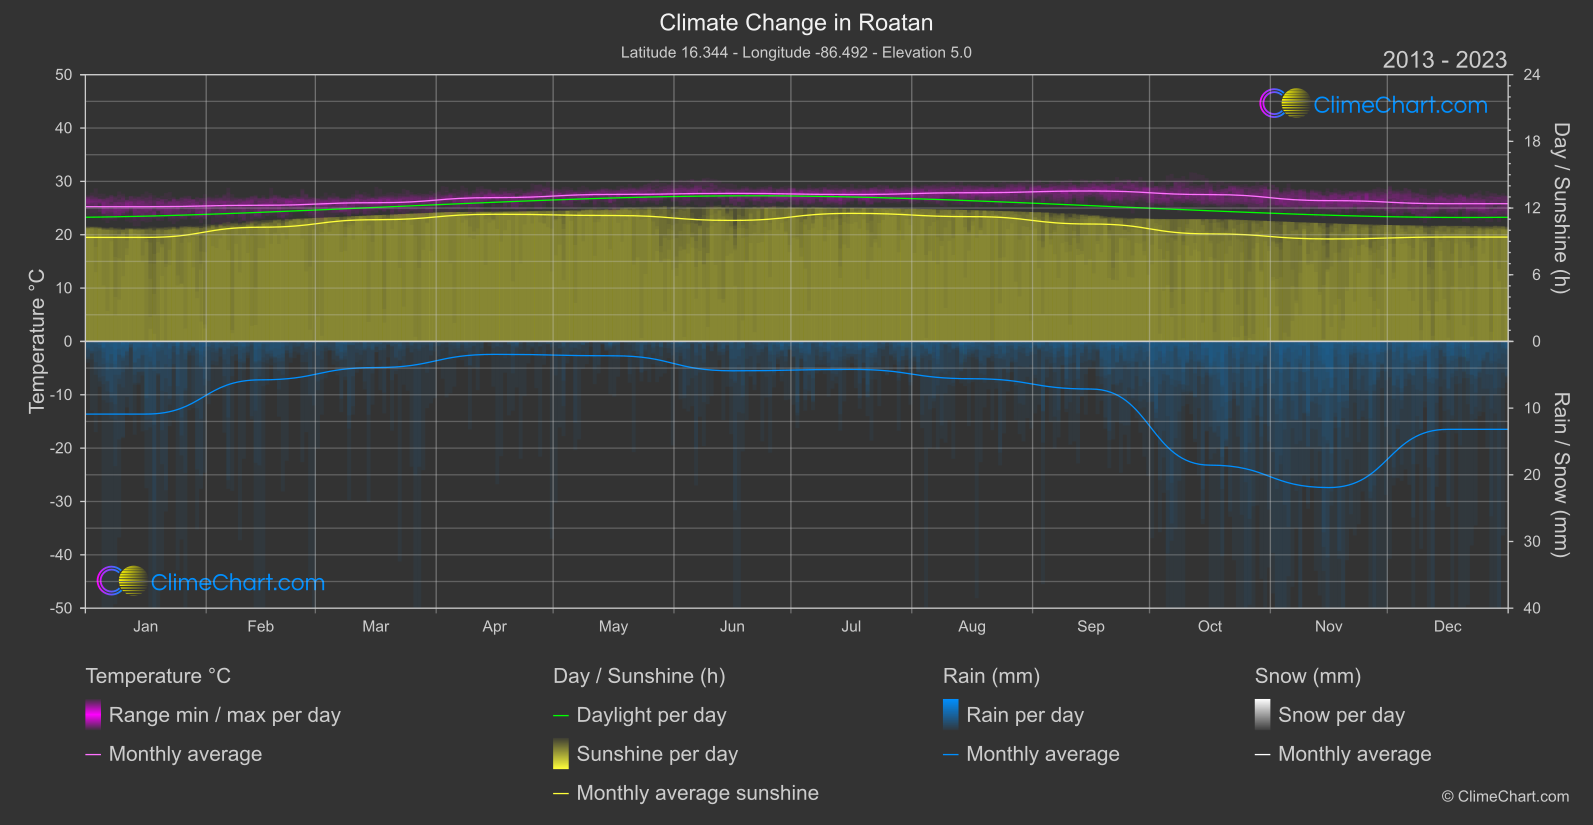
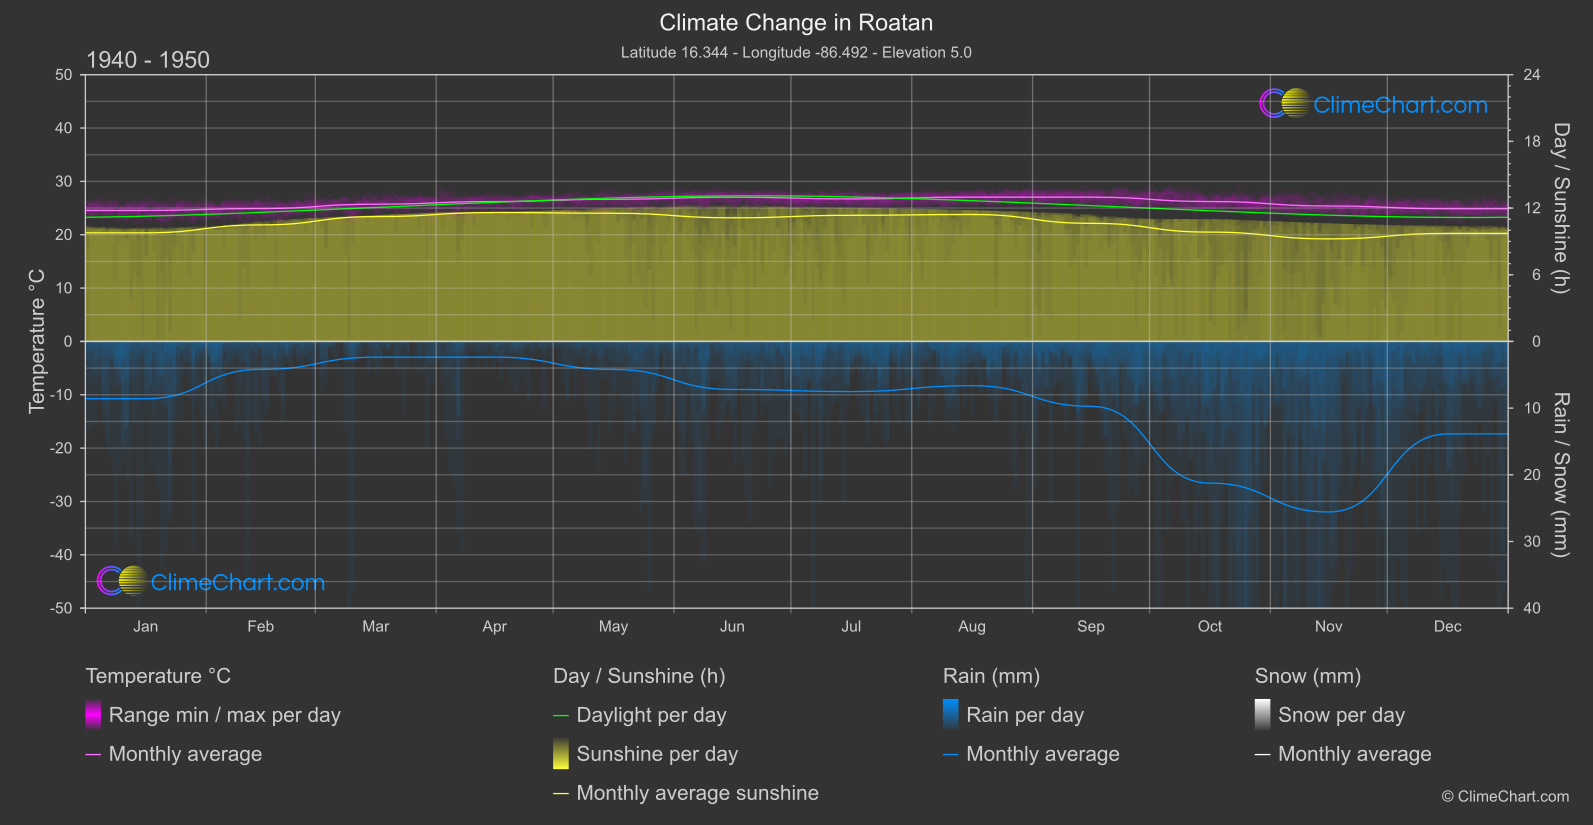
Roatan, Honduras, has experienced significant changes in its climate patterns. Analyzing the data reveals interesting trends, such as the notable increase in temperatures across various months. The month with the highest temperature change is typically October, with a significant rise compared to historical records. In terms of rainfall, the data shows fluctuations in precipitation levels, with some months experiencing a decrease while others show an increase. Additionally, the sunshine duration has also varied, indicating shifts in weather patterns over the years.
Climate Change Data Overview for Roatan, Honduras
Explore the comprehensive climate change data for Roatan, Honduras. This detailed table provides valuable insights into temperature variations, precipitation levels, and seasonal changes influenced by climate change, helping you understand the unique weather patterns of this region.
Temperature °C
| Month | ⌀ 1940 - 1950 | ⌀ 2013 - 2023 | +/- |
|---|---|---|---|
| Jan | 24.55 | 25.25 | 0.70 |
| Feb | 24.91 | 25.52 | 0.62 |
| Mar | 25.73 | 26.00 | 0.28 |
| Apr | 26.22 | 26.96 | 0.74 |
| May | 26.66 | 27.56 | 0.90 |
| Jun | 27.04 | 27.75 | 0.71 |
| Jul | 26.72 | 27.54 | 0.82 |
| Aug | 27.05 | 27.88 | 0.83 |
| Sep | 27.05 | 28.20 | 1.15 |
| Oct | 26.22 | 27.52 | 1.30 |
| Nov | 25.38 | 26.39 | 1.01 |
| Dec | 24.87 | 25.82 | 0.94 |
| ⌀ Month | 26.03 | 26.87 | 0.83 |
Sunshine (h)
| Month | ⌀ 1940 - 1950 | ⌀ 2013 - 2023 | +/- |
|---|---|---|---|
| Jan | 9.77 | 9.36 | -0.41 |
| Feb | 10.48 | 10.28 | -0.21 |
| Mar | 11.23 | 10.95 | -0.28 |
| Apr | 11.60 | 11.44 | -0.15 |
| May | 11.53 | 11.33 | -0.20 |
| Jun | 11.12 | 10.89 | -0.23 |
| Jul | 11.35 | 11.52 | 0.17 |
| Aug | 11.42 | 11.23 | -0.19 |
| Sep | 10.63 | 10.56 | -0.06 |
| Oct | 9.84 | 9.68 | -0.16 |
| Nov | 9.23 | 9.22 | -0.00 |
| Dec | 9.72 | 9.39 | -0.33 |
| ⌀ Month | 10.66 | 10.49 | -0.17 |
Rain (mm)
| Month | ⌀ 1940 - 1950 | ⌀ 2013 - 2023 | +/- |
|---|---|---|---|
| Jan | 4.29 | 5.45 | 1.16 |
| Feb | 2.10 | 2.88 | 0.78 |
| Mar | 1.18 | 1.96 | 0.78 |
| Apr | 1.18 | 0.97 | -0.21 |
| May | 2.10 | 1.08 | -1.03 |
| Jun | 3.60 | 2.20 | -1.40 |
| Jul | 3.76 | 2.10 | -1.66 |
| Aug | 3.32 | 2.80 | -0.52 |
| Sep | 4.87 | 3.57 | -1.30 |
| Oct | 10.62 | 9.28 | -1.35 |
| Nov | 12.79 | 10.96 | -1.83 |
| Dec | 6.93 | 6.59 | -0.34 |
| ⌀ Month | 4.73 | 4.15 | -0.58 |
Snow (mm)
| Month | ⌀ 1940 - 1950 | ⌀ 2013 - 2023 | +/- |
|---|---|---|---|
| Jan | 0.00 | 0.00 | 0.00 |
| Feb | 0.00 | 0.00 | 0.00 |
| Mar | 0.00 | 0.00 | 0.00 |
| Apr | 0.00 | 0.00 | 0.00 |
| May | 0.00 | 0.00 | 0.00 |
| Jun | 0.00 | 0.00 | 0.00 |
| Jul | 0.00 | 0.00 | 0.00 |
| Aug | 0.00 | 0.00 | 0.00 |
| Sep | 0.00 | 0.00 | 0.00 |
| Oct | 0.00 | 0.00 | 0.00 |
| Nov | 0.00 | 0.00 | 0.00 |
| Dec | 0.00 | 0.00 | 0.00 |
| ⌀ Month | 0.00 | 0.00 | 0.00 |