Climate Change Chart of Raleigh, USA
Comprehensive Climate Change Chart of Raleigh, USA: Monthly Averages and Impact Trends
Exploring the changing climate in Raleigh, USA reveals intriguing insights into temperature, rainfall, snowfall, and sunshine duration over the years.
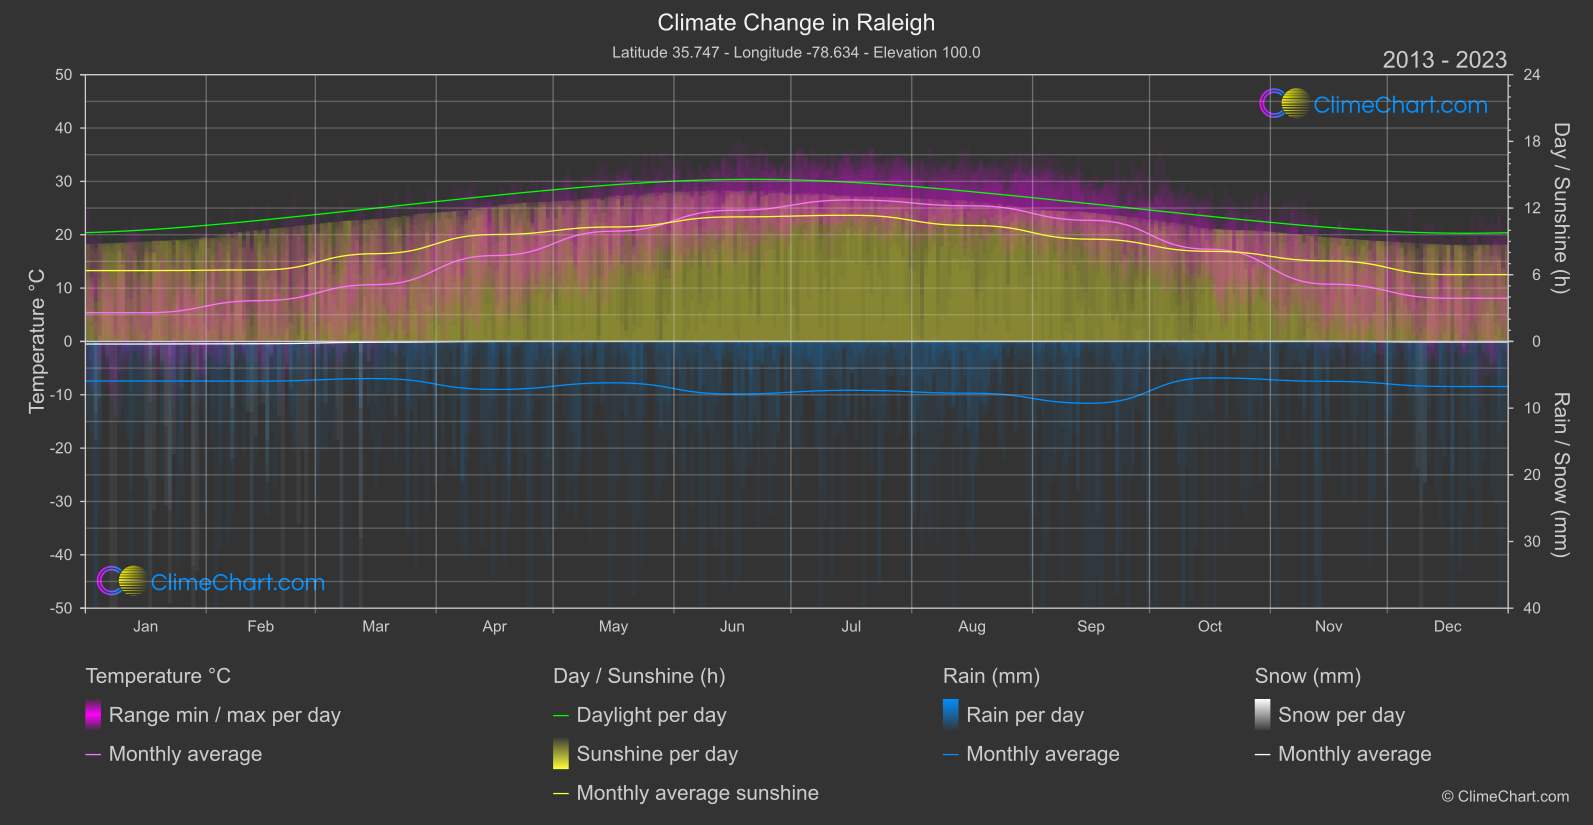
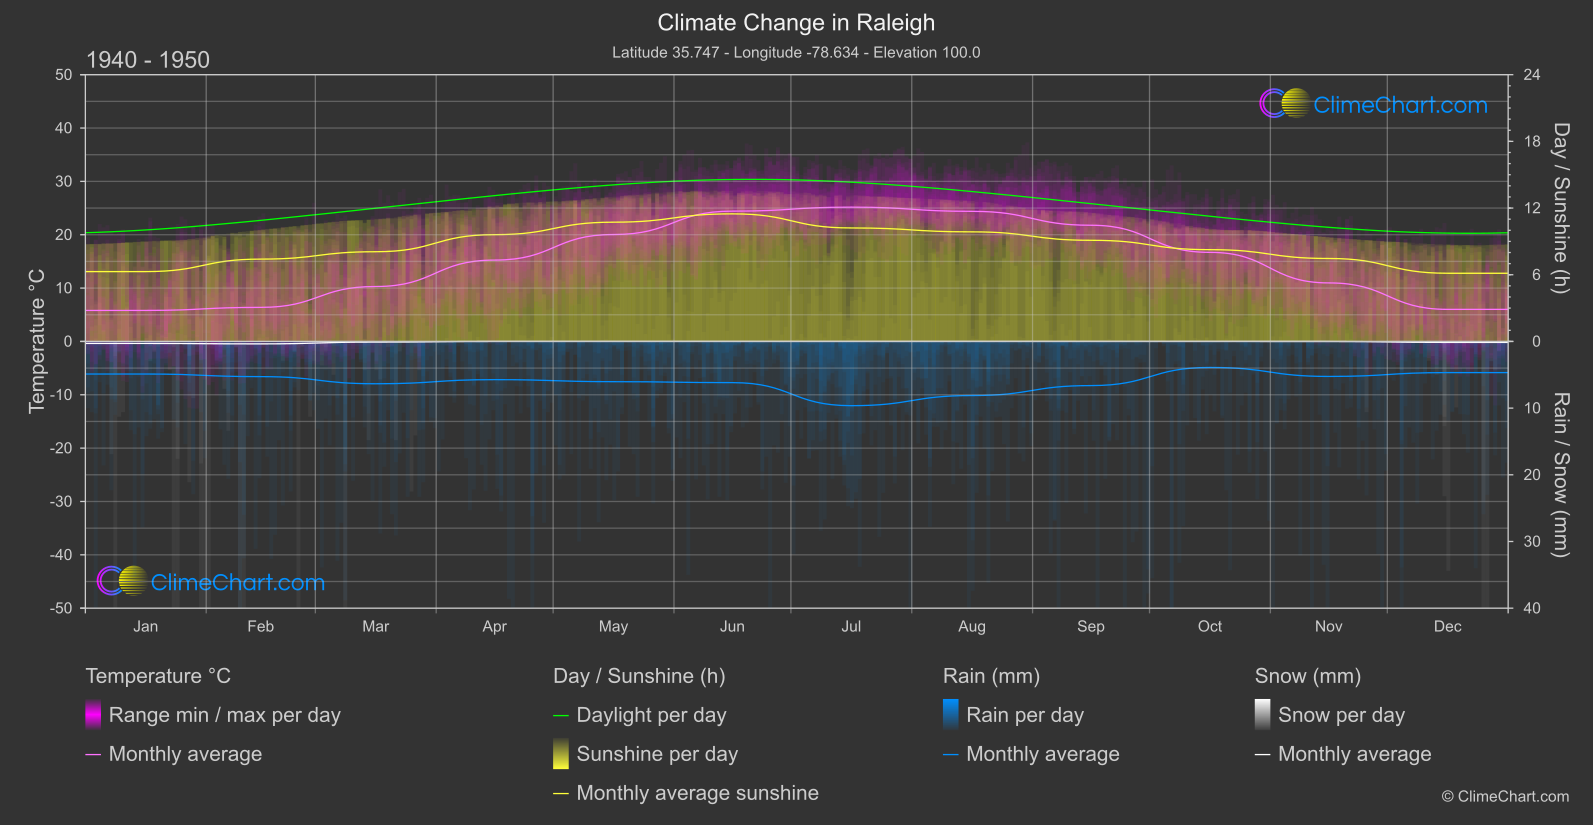
Raleigh, USA has experienced various changes in climate parameters. The data from the period 1940-1950 compared to 2013-2024 shows fluctuations in temperature, rainfall, snowfall, and sunshine duration. For temperature, December witnessed the highest increase of 2.09°C, while July had the most significant rise in rainfall by 1.15mm. Snowfall remained relatively stable over the years. Interestingly, July experienced the most notable increase in sunshine duration by 1.14 hours. These insights highlight the dynamic nature of climate change in Raleigh, USA.
Climate Change Data Overview for Raleigh, USA
Explore the comprehensive climate change data for Raleigh, USA. This detailed table provides valuable insights into temperature variations, precipitation levels, and seasonal changes influenced by climate change, helping you understand the unique weather patterns of this region.
Temperature °C
| Month | ⌀ 1940 - 1950 | ⌀ 2013 - 2023 | +/- |
|---|---|---|---|
| Jan | 5.81 | 5.38 | -0.43 |
| Feb | 6.38 | 7.65 | 1.27 |
| Mar | 10.29 | 10.66 | 0.36 |
| Apr | 15.25 | 16.09 | 0.85 |
| May | 20.04 | 20.67 | 0.63 |
| Jun | 24.42 | 24.57 | 0.15 |
| Jul | 25.17 | 26.52 | 1.34 |
| Aug | 24.38 | 25.42 | 1.04 |
| Sep | 21.78 | 22.70 | 0.92 |
| Oct | 16.70 | 17.28 | 0.59 |
| Nov | 10.97 | 10.74 | -0.23 |
| Dec | 6.01 | 8.10 | 2.09 |
| ⌀ Month | 15.60 | 16.31 | 0.71 |
Sunshine (h)
| Month | ⌀ 1940 - 1950 | ⌀ 2013 - 2023 | +/- |
|---|---|---|---|
| Jan | 6.28 | 6.37 | 0.09 |
| Feb | 7.41 | 6.43 | -0.97 |
| Mar | 8.07 | 7.89 | -0.18 |
| Apr | 9.61 | 9.62 | 0.01 |
| May | 10.73 | 10.30 | -0.43 |
| Jun | 11.48 | 11.20 | -0.27 |
| Jul | 10.21 | 11.35 | 1.14 |
| Aug | 9.86 | 10.43 | 0.57 |
| Sep | 9.10 | 9.20 | 0.10 |
| Oct | 8.26 | 8.11 | -0.15 |
| Nov | 7.46 | 7.24 | -0.22 |
| Dec | 6.13 | 6.01 | -0.12 |
| ⌀ Month | 8.72 | 8.68 | -0.04 |
Rain (mm)
| Month | ⌀ 1940 - 1950 | ⌀ 2013 - 2023 | +/- |
|---|---|---|---|
| Jan | 2.44 | 2.97 | 0.52 |
| Feb | 2.64 | 2.98 | 0.34 |
| Mar | 3.17 | 2.78 | -0.39 |
| Apr | 2.86 | 3.60 | 0.74 |
| May | 3.02 | 3.10 | 0.09 |
| Jun | 3.09 | 3.94 | 0.85 |
| Jul | 4.82 | 3.66 | -1.15 |
| Aug | 4.06 | 3.88 | -0.17 |
| Sep | 3.31 | 4.64 | 1.33 |
| Oct | 1.95 | 2.74 | 0.78 |
| Nov | 2.62 | 2.99 | 0.37 |
| Dec | 2.34 | 3.38 | 1.04 |
| ⌀ Month | 3.03 | 3.39 | 0.36 |
Snow (mm)
| Month | ⌀ 1940 - 1950 | ⌀ 2013 - 2023 | +/- |
|---|---|---|---|
| Jan | 0.15 | 0.19 | 0.04 |
| Feb | 0.18 | 0.17 | -0.01 |
| Mar | 0.05 | 0.06 | 0.01 |
| Apr | 0.00 | 0.00 | 0.00 |
| May | 0.00 | 0.00 | 0.00 |
| Jun | 0.00 | 0.00 | 0.00 |
| Jul | 0.00 | 0.00 | 0.00 |
| Aug | 0.00 | 0.00 | 0.00 |
| Sep | 0.00 | 0.00 | 0.00 |
| Oct | 0.00 | 0.00 | 0.00 |
| Nov | 0.00 | 0.00 | -0.00 |
| Dec | 0.07 | 0.05 | -0.03 |
| ⌀ Month | 0.04 | 0.04 | 0.00 |