Climate Change Chart of Qaanaaq, Greenland
Comprehensive Climate Change Chart of Qaanaaq, Greenland: Monthly Averages and Impact Trends
Explore the changing climate in Qaanaaq, Greenland with insightful data analysis. Discover the trends in temperature, rainfall, snowfall, and sunshine duration between 1940 - 1950 and 2013 - 2024.
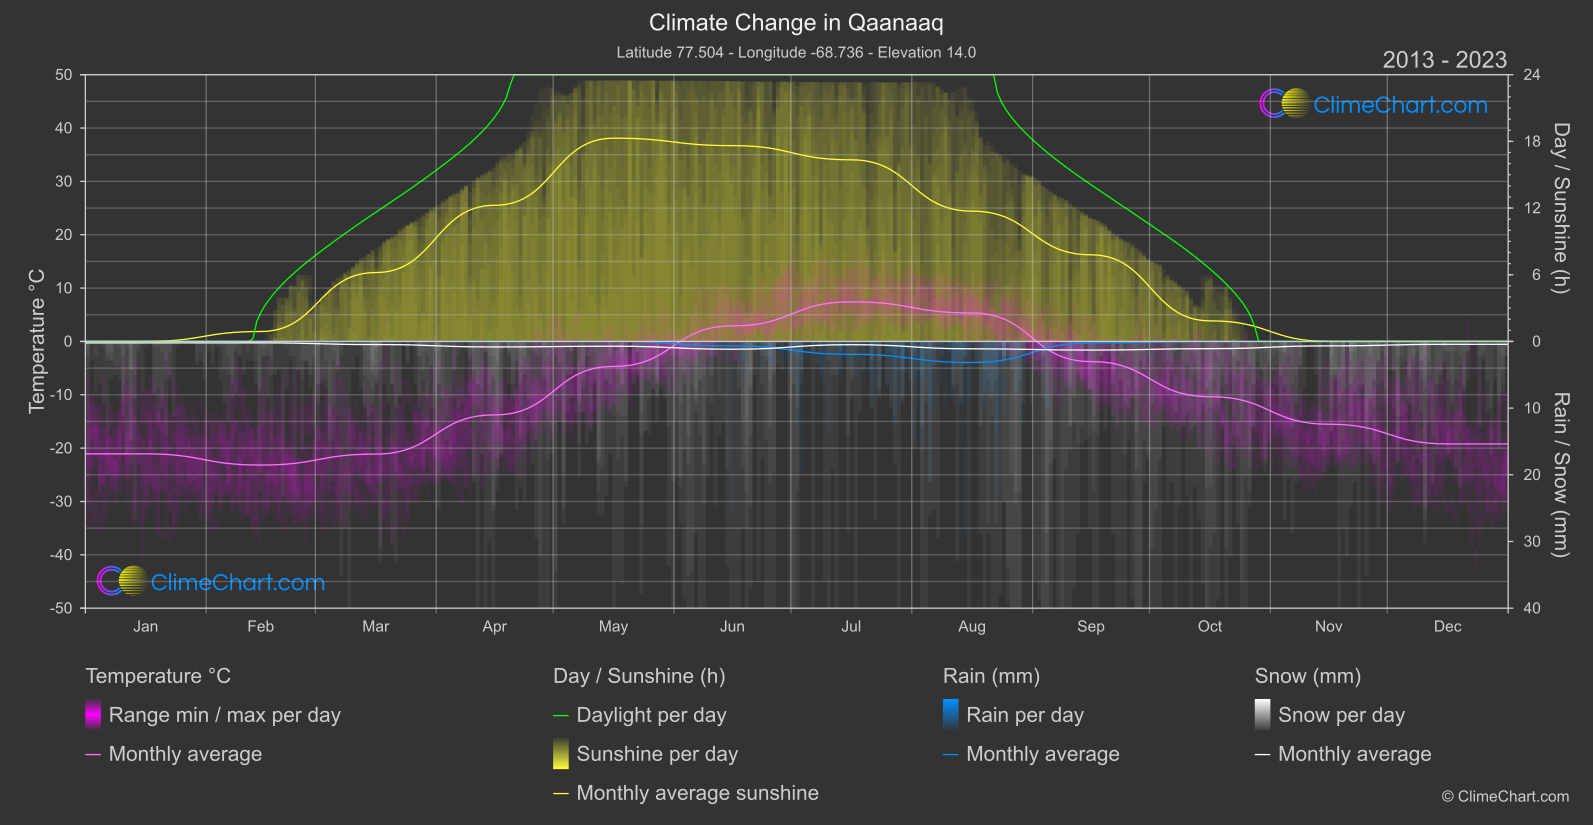
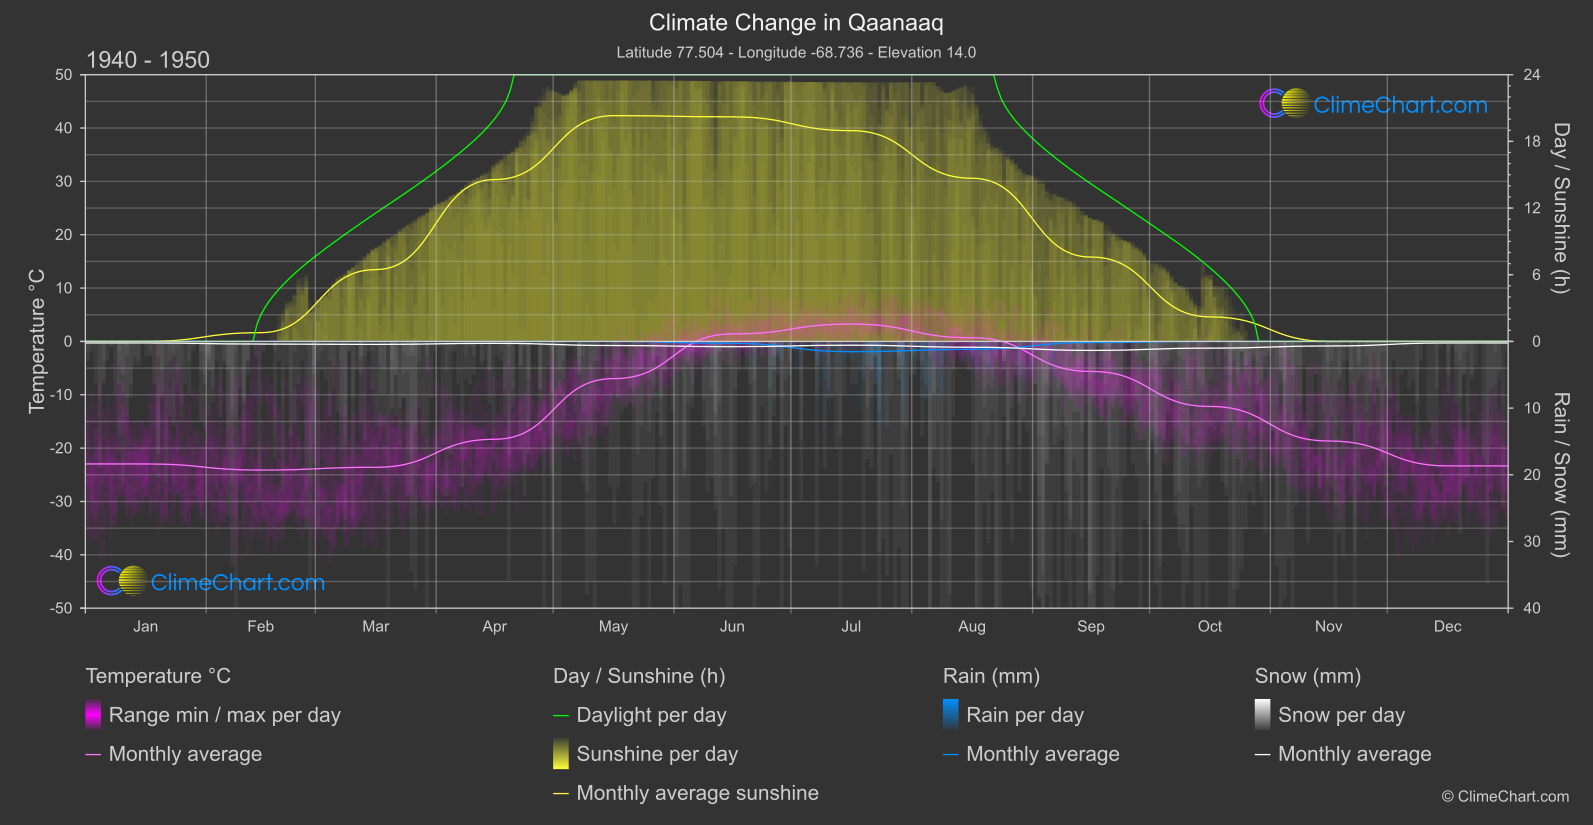
Qaanaaq, Greenland, experiences significant changes in climate parameters over the years. The data shows that April has the highest temperature change of 4.57°C between the two periods analyzed. In terms of rainfall, August stands out with a notable increase of 0.988 mm. Snowfall, on the other hand, sees the most significant change in April with a 0.27 mm increase. Lastly, sunshine duration shows a decrease throughout the analyzed months, with the most significant drop in August by 2.96 hours.
Climate Change Data Overview for Qaanaaq, Greenland
Explore the comprehensive climate change data for Qaanaaq, Greenland. This detailed table provides valuable insights into temperature variations, precipitation levels, and seasonal changes influenced by climate change, helping you understand the unique weather patterns of this region.
Temperature °C
| Month | ⌀ 1940 - 1950 | ⌀ 2013 - 2023 | +/- |
|---|---|---|---|
| Jan | -22.96 | -21.08 | 1.89 |
| Feb | -24.11 | -23.17 | 0.94 |
| Mar | -23.59 | -21.12 | 2.47 |
| Apr | -18.34 | -13.77 | 4.57 |
| May | -6.97 | -4.68 | 2.28 |
| Jun | 1.41 | 2.91 | 1.50 |
| Jul | 3.25 | 7.42 | 4.17 |
| Aug | 0.69 | 5.34 | 4.65 |
| Sep | -5.62 | -3.78 | 1.85 |
| Oct | -12.19 | -10.36 | 1.83 |
| Nov | -18.66 | -15.51 | 3.15 |
| Dec | -23.33 | -19.22 | 4.12 |
| ⌀ Month | -12.54 | -9.75 | 2.78 |
Sunshine (h)
| Month | ⌀ 1940 - 1950 | ⌀ 2013 - 2023 | +/- |
|---|---|---|---|
| Jan | 0.00 | 0.00 | 0.00 |
| Feb | 0.79 | 0.89 | 0.10 |
| Mar | 6.46 | 6.20 | -0.27 |
| Apr | 14.57 | 12.25 | -2.32 |
| May | 20.31 | 18.29 | -2.03 |
| Jun | 20.21 | 17.62 | -2.59 |
| Jul | 18.96 | 16.34 | -2.62 |
| Aug | 14.68 | 11.72 | -2.96 |
| Sep | 7.59 | 7.79 | 0.20 |
| Oct | 2.21 | 1.85 | -0.36 |
| Nov | 0.00 | 0.00 | 0.00 |
| Dec | 0.00 | 0.00 | 0.00 |
| ⌀ Month | 8.82 | 7.75 | -1.07 |
Rain (mm)
| Month | ⌀ 1940 - 1950 | ⌀ 2013 - 2023 | +/- |
|---|---|---|---|
| Jan | 0.00 | 0.00 | 0.00 |
| Feb | 0.00 | 0.00 | 0.00 |
| Mar | 0.00 | 0.00 | 0.00 |
| Apr | 0.00 | 0.01 | 0.01 |
| May | 0.01 | 0.00 | -0.00 |
| Jun | 0.14 | 0.34 | 0.20 |
| Jul | 0.77 | 0.97 | 0.20 |
| Aug | 0.59 | 1.58 | 0.99 |
| Sep | 0.08 | 0.11 | 0.03 |
| Oct | 0.00 | 0.01 | 0.01 |
| Nov | 0.00 | 0.00 | 0.00 |
| Dec | 0.00 | 0.00 | 0.00 |
| ⌀ Month | 0.13 | 0.25 | 0.12 |
Snow (mm)
| Month | ⌀ 1940 - 1950 | ⌀ 2013 - 2023 | +/- |
|---|---|---|---|
| Jan | 0.11 | 0.11 | -0.00 |
| Feb | 0.20 | 0.11 | -0.09 |
| Mar | 0.22 | 0.23 | 0.01 |
| Apr | 0.14 | 0.41 | 0.27 |
| May | 0.31 | 0.36 | 0.05 |
| Jun | 0.39 | 0.58 | 0.19 |
| Jul | 0.28 | 0.24 | -0.04 |
| Aug | 0.44 | 0.55 | 0.12 |
| Sep | 0.67 | 0.65 | -0.02 |
| Oct | 0.50 | 0.54 | 0.04 |
| Nov | 0.34 | 0.33 | -0.01 |
| Dec | 0.11 | 0.21 | 0.10 |
| ⌀ Month | 0.31 | 0.36 | 0.05 |