Climate Change Chart of Pisa, Italy
Comprehensive Climate Change Chart of Pisa, Italy: Monthly Averages and Impact Trends
Explore the climate change data for Pisa, Italy, showcasing temperature, rainfall, snowfall, and sunshine duration trends from 1940-1950 to 2013-2024.
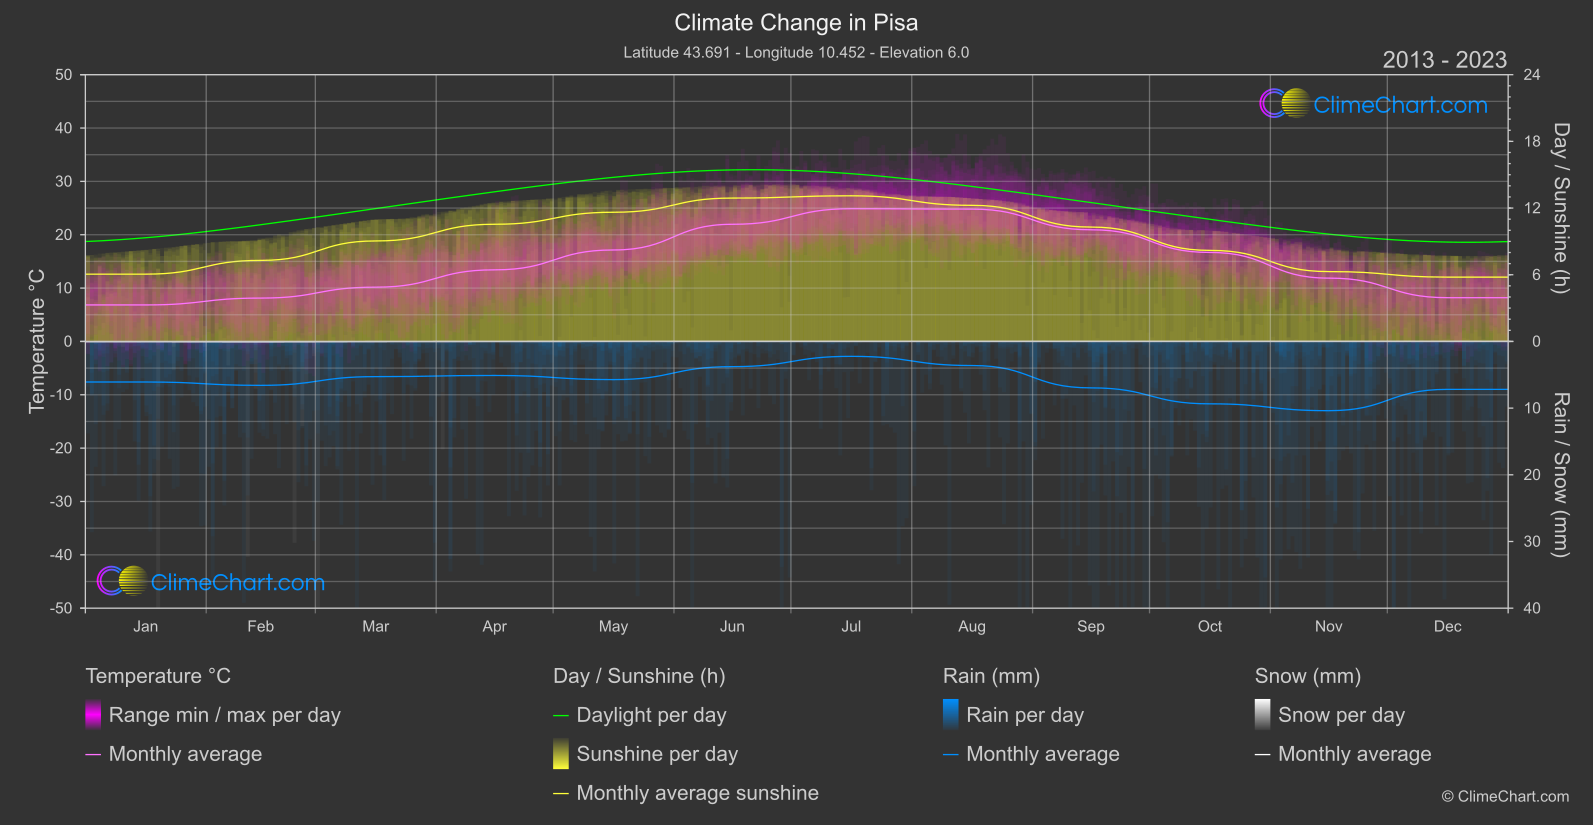
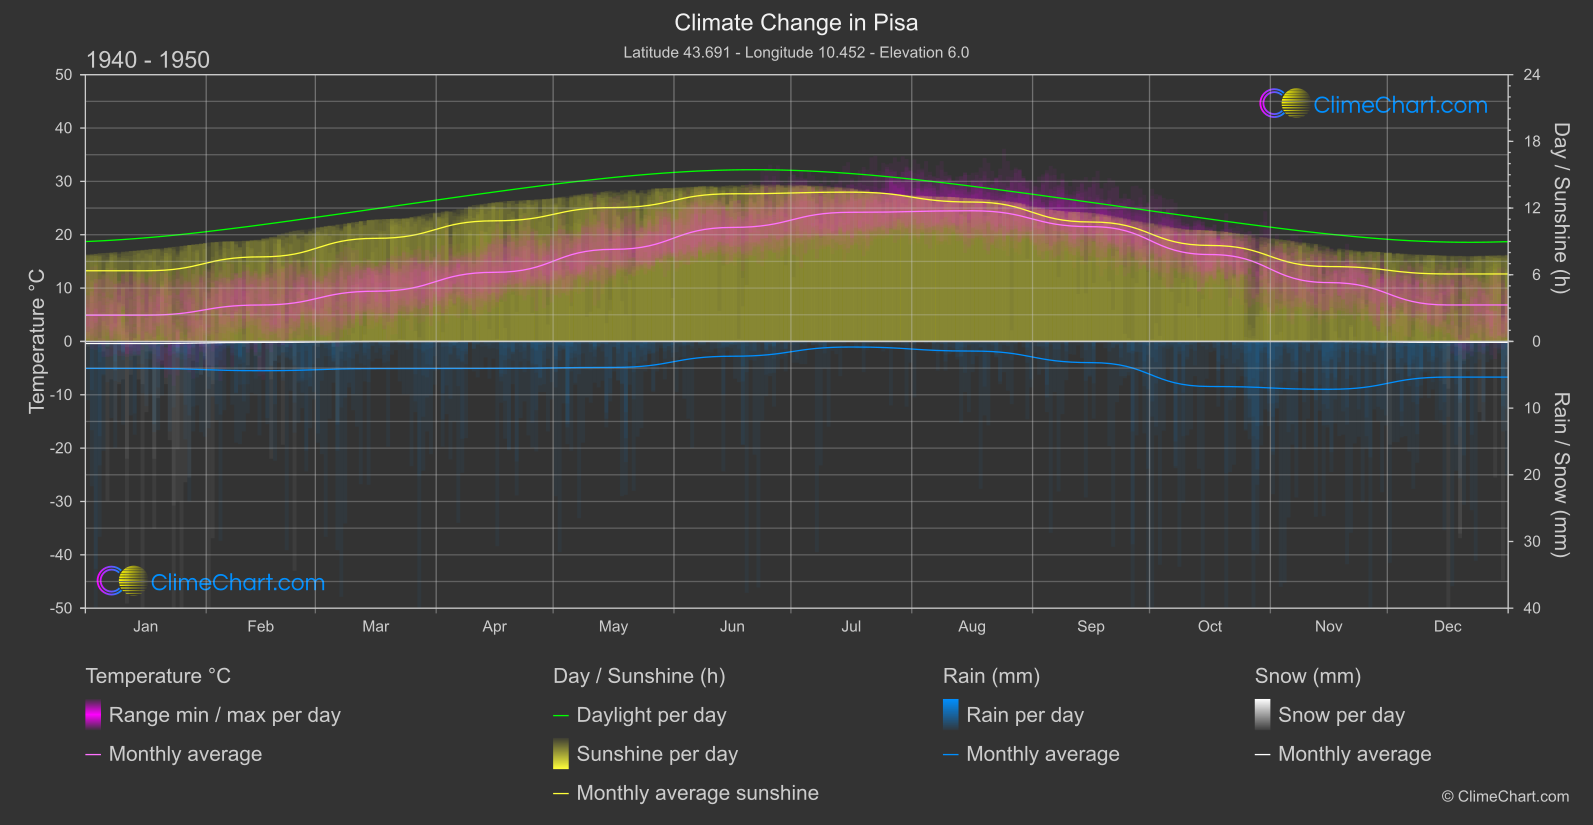
Pisa, Italy, has experienced significant changes in its climate over the years. The data reveals that the month of January has shown the highest increase in temperature from 1940-1950 to 2013-2024, with a change of 1.91°C. In terms of rainfall, September saw the most substantial increase of 1.89mm. Snowfall has generally decreased over the years, with notable reductions in December. Additionally, the duration of sunshine has decreased across all months, with the most significant drop in September by 0.46 hours.
Climate Change Data Overview for Pisa, Italy
Explore the comprehensive climate change data for Pisa, Italy. This detailed table provides valuable insights into temperature variations, precipitation levels, and seasonal changes influenced by climate change, helping you understand the unique weather patterns of this region.
Temperature °C
| Month | ⌀ 1940 - 1950 | ⌀ 2013 - 2023 | +/- |
|---|---|---|---|
| Jan | 4.93 | 6.84 | 1.91 |
| Feb | 6.83 | 8.12 | 1.30 |
| Mar | 9.41 | 10.17 | 0.76 |
| Apr | 12.96 | 13.42 | 0.46 |
| May | 17.26 | 17.14 | -0.12 |
| Jun | 21.37 | 21.96 | 0.59 |
| Jul | 24.21 | 24.88 | 0.67 |
| Aug | 24.49 | 24.80 | 0.31 |
| Sep | 21.51 | 20.93 | -0.58 |
| Oct | 16.29 | 16.68 | 0.39 |
| Nov | 11.03 | 11.87 | 0.84 |
| Dec | 6.83 | 8.20 | 1.37 |
| ⌀ Month | 14.76 | 15.42 | 0.66 |
Sunshine (h)
| Month | ⌀ 1940 - 1950 | ⌀ 2013 - 2023 | +/- |
|---|---|---|---|
| Jan | 6.36 | 6.05 | -0.30 |
| Feb | 7.61 | 7.29 | -0.32 |
| Mar | 9.28 | 9.04 | -0.23 |
| Apr | 10.85 | 10.54 | -0.31 |
| May | 12.05 | 11.62 | -0.42 |
| Jun | 13.28 | 12.90 | -0.39 |
| Jul | 13.43 | 13.10 | -0.33 |
| Aug | 12.54 | 12.24 | -0.30 |
| Sep | 10.75 | 10.29 | -0.46 |
| Oct | 8.64 | 8.19 | -0.44 |
| Nov | 6.74 | 6.28 | -0.45 |
| Dec | 6.07 | 5.79 | -0.29 |
| ⌀ Month | 9.80 | 9.45 | -0.35 |
Rain (mm)
| Month | ⌀ 1940 - 1950 | ⌀ 2013 - 2023 | +/- |
|---|---|---|---|
| Jan | 2.02 | 3.04 | 1.02 |
| Feb | 2.19 | 3.29 | 1.10 |
| Mar | 2.04 | 2.64 | 0.60 |
| Apr | 2.02 | 2.55 | 0.53 |
| May | 1.95 | 2.86 | 0.92 |
| Jun | 1.11 | 1.89 | 0.78 |
| Jul | 0.42 | 1.12 | 0.70 |
| Aug | 0.72 | 1.81 | 1.09 |
| Sep | 1.59 | 3.48 | 1.89 |
| Oct | 3.38 | 4.68 | 1.30 |
| Nov | 3.59 | 5.19 | 1.60 |
| Dec | 2.67 | 3.59 | 0.92 |
| ⌀ Month | 1.98 | 3.01 | 1.04 |
Snow (mm)
| Month | ⌀ 1940 - 1950 | ⌀ 2013 - 2023 | +/- |
|---|---|---|---|
| Jan | 0.16 | 0.02 | -0.14 |
| Feb | 0.07 | 0.03 | -0.04 |
| Mar | 0.00 | 0.01 | 0.01 |
| Apr | 0.00 | 0.00 | 0.00 |
| May | 0.00 | 0.00 | 0.00 |
| Jun | 0.00 | 0.00 | 0.00 |
| Jul | 0.00 | 0.00 | 0.00 |
| Aug | 0.00 | 0.00 | 0.00 |
| Sep | 0.00 | 0.00 | 0.00 |
| Oct | 0.00 | 0.00 | 0.00 |
| Nov | 0.00 | 0.00 | -0.00 |
| Dec | 0.07 | 0.00 | -0.07 |
| ⌀ Month | 0.03 | 0.01 | -0.02 |