Climate Change Chart of Pierre, USA
Comprehensive Climate Change Chart of Pierre, USA: Monthly Averages and Impact Trends
Explore the changing climate in Pierre, USA with insightful data analysis. Discover how temperatures, rainfall, snowfall, and sunshine duration have evolved over the years.
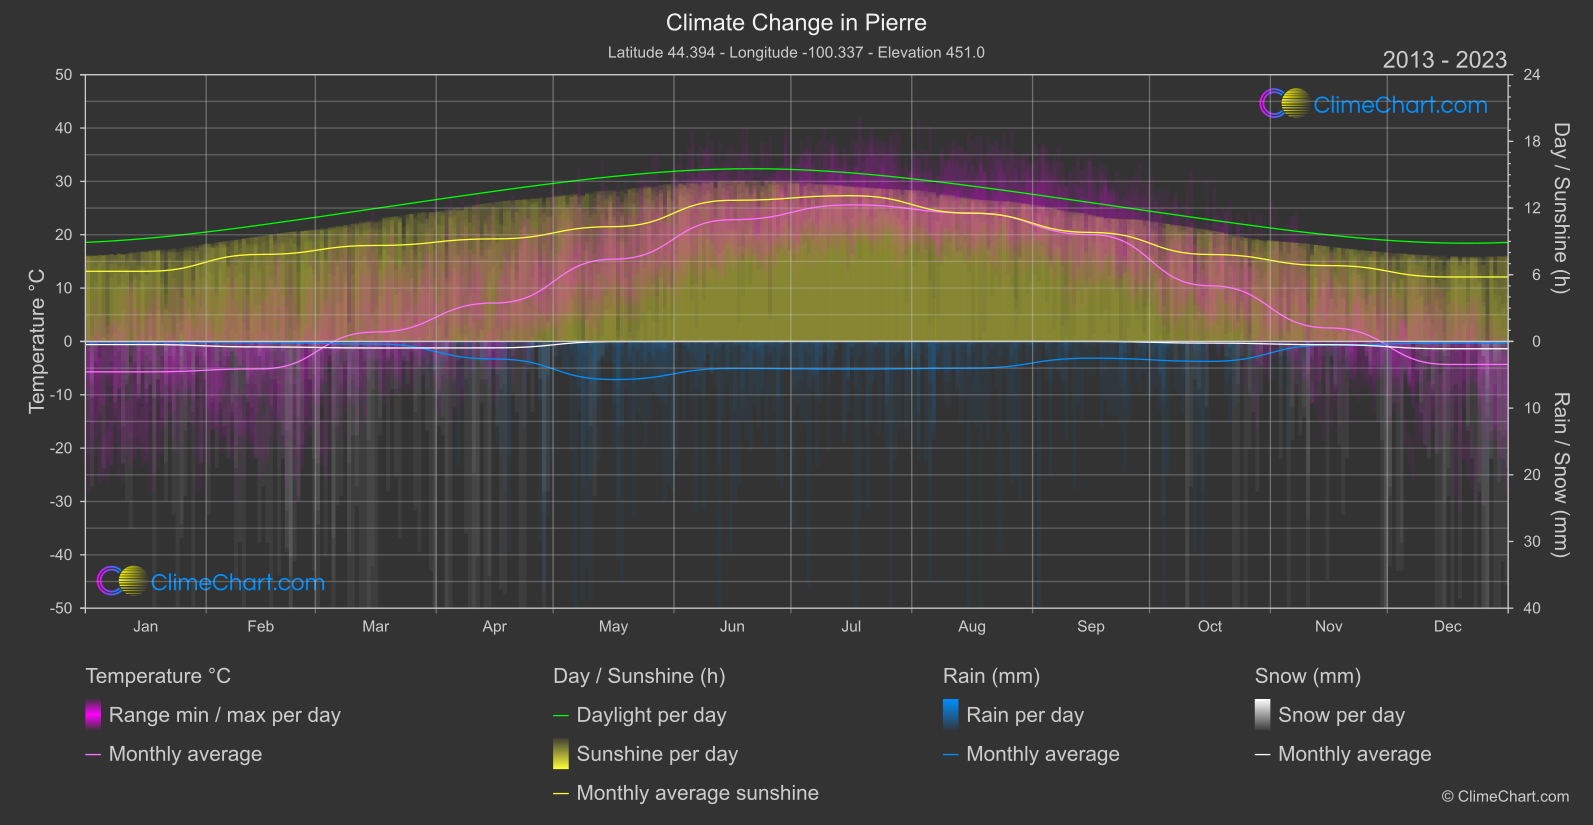
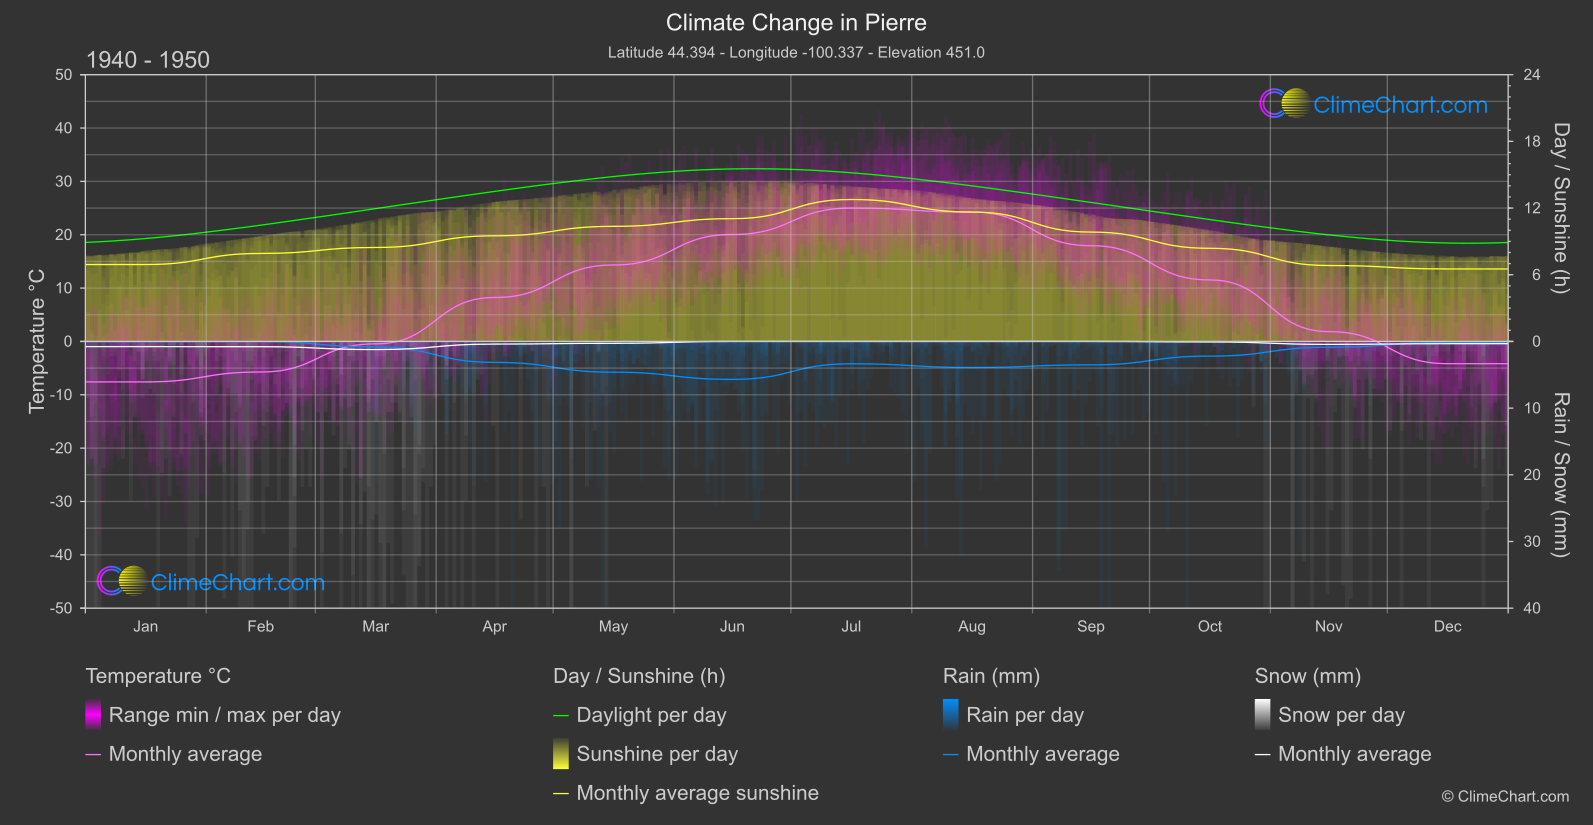
Delve deeper into the climate and weather patterns in Pierre, USA. The data from 1940 to 1950 compared to 2013 to 2024 reveals significant changes in temperature, rainfall, snowfall, and sunshine duration. Notable findings include a steady increase in June temperatures by 2.78°C, a decrease in September snowfall by 0.0004 mm, and a spike in December sunshine duration by 0.72 hours.
Climate Change Data Overview for Pierre, USA
Explore the comprehensive climate change data for Pierre, USA. This detailed table provides valuable insights into temperature variations, precipitation levels, and seasonal changes influenced by climate change, helping you understand the unique weather patterns of this region.
Temperature °C
| Month | ⌀ 1940 - 1950 | ⌀ 2013 - 2023 | +/- |
|---|---|---|---|
| Jan | -7.59 | -5.70 | 1.88 |
| Feb | -5.73 | -5.14 | 0.59 |
| Mar | -0.45 | 1.76 | 2.21 |
| Apr | 8.24 | 7.20 | -1.03 |
| May | 14.33 | 15.42 | 1.09 |
| Jun | 20.04 | 22.82 | 2.78 |
| Jul | 25.00 | 25.60 | 0.60 |
| Aug | 24.23 | 24.07 | -0.16 |
| Sep | 17.94 | 20.01 | 2.07 |
| Oct | 11.53 | 10.43 | -1.09 |
| Nov | 1.84 | 2.53 | 0.69 |
| Dec | -4.17 | -4.31 | -0.14 |
| ⌀ Month | 8.77 | 9.56 | 0.79 |
Sunshine (h)
| Month | ⌀ 1940 - 1950 | ⌀ 2013 - 2023 | +/- |
|---|---|---|---|
| Jan | 6.92 | 6.31 | -0.61 |
| Feb | 7.92 | 7.83 | -0.09 |
| Mar | 8.45 | 8.64 | 0.18 |
| Apr | 9.50 | 9.23 | -0.28 |
| May | 10.35 | 10.33 | -0.03 |
| Jun | 11.04 | 12.70 | 1.65 |
| Jul | 12.77 | 13.11 | 0.34 |
| Aug | 11.64 | 11.53 | -0.11 |
| Sep | 9.84 | 9.81 | -0.03 |
| Oct | 8.38 | 7.82 | -0.56 |
| Nov | 6.83 | 6.82 | -0.01 |
| Dec | 6.52 | 5.80 | -0.72 |
| ⌀ Month | 9.18 | 9.16 | -0.02 |
Rain (mm)
| Month | ⌀ 1940 - 1950 | ⌀ 2013 - 2023 | +/- |
|---|---|---|---|
| Jan | 0.03 | 0.06 | 0.03 |
| Feb | 0.01 | 0.07 | 0.07 |
| Mar | 0.41 | 0.19 | -0.22 |
| Apr | 1.57 | 1.32 | -0.26 |
| May | 2.31 | 2.86 | 0.55 |
| Jun | 2.85 | 2.02 | -0.82 |
| Jul | 1.68 | 2.08 | 0.40 |
| Aug | 1.95 | 2.00 | 0.05 |
| Sep | 1.76 | 1.25 | -0.50 |
| Oct | 1.10 | 1.50 | 0.40 |
| Nov | 0.44 | 0.27 | -0.17 |
| Dec | 0.07 | 0.12 | 0.05 |
| ⌀ Month | 1.18 | 1.14 | -0.04 |
Snow (mm)
| Month | ⌀ 1940 - 1950 | ⌀ 2013 - 2023 | +/- |
|---|---|---|---|
| Jan | 0.39 | 0.23 | -0.15 |
| Feb | 0.39 | 0.41 | 0.02 |
| Mar | 0.61 | 0.49 | -0.12 |
| Apr | 0.20 | 0.48 | 0.28 |
| May | 0.14 | 0.01 | -0.13 |
| Jun | 0.00 | 0.00 | 0.00 |
| Jul | 0.00 | 0.00 | 0.00 |
| Aug | 0.00 | 0.00 | 0.00 |
| Sep | 0.00 | 0.00 | -0.00 |
| Oct | 0.04 | 0.13 | 0.09 |
| Nov | 0.22 | 0.24 | 0.02 |
| Dec | 0.17 | 0.55 | 0.38 |
| ⌀ Month | 0.18 | 0.21 | 0.03 |