Climate Change Chart of Penang Island, Malaysia
Comprehensive Climate Change Chart of Penang Island, Malaysia: Monthly Averages and Impact Trends
Explore the changing climate of Penang Island, Malaysia with insightful data analysis.
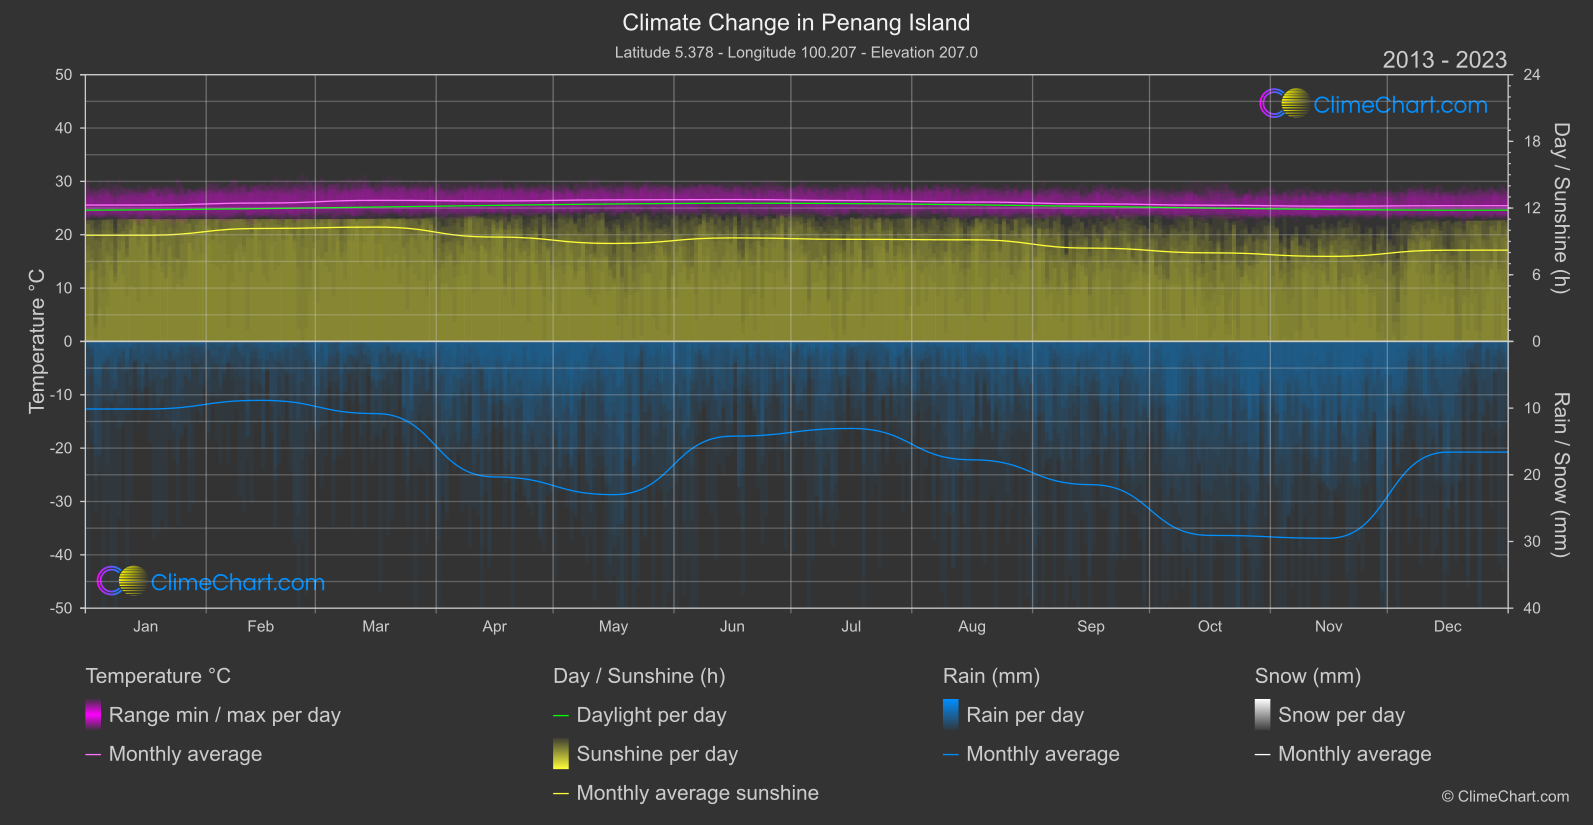
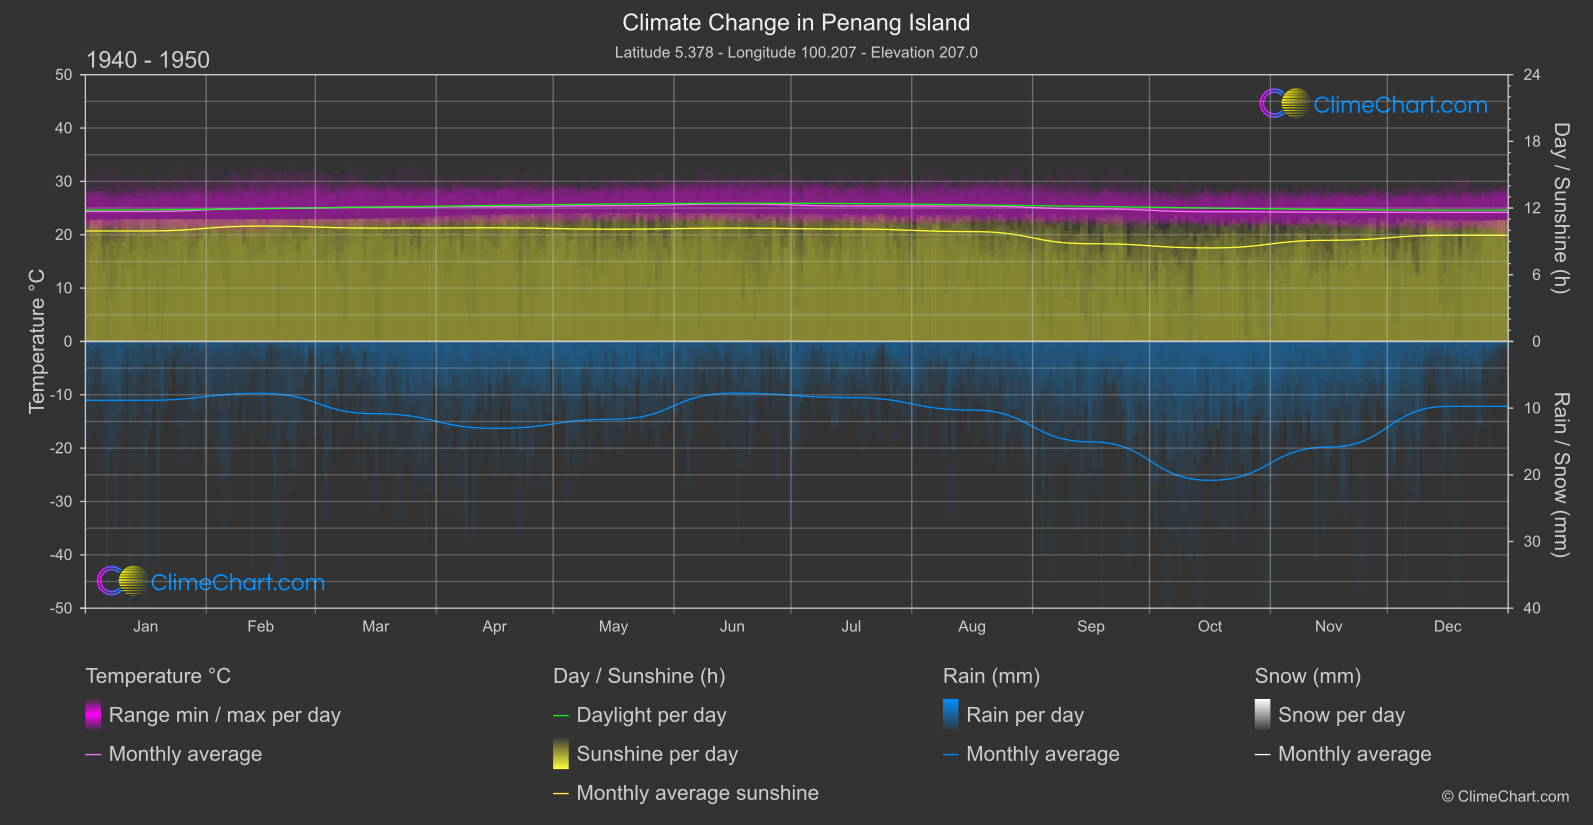
Penang Island, Malaysia, has experienced notable changes in temperature, rainfall, and sunshine duration over the years. From 1940 to 1950 compared to 2013 to 2024, the data shows a consistent increase in temperature across all months. The month with the highest temperature change is March, with an increase of 1.28°C. In terms of rainfall, the data reflects varying trends with significant changes in precipitation levels. The month of November stands out with the highest increase in rainfall by 6.84mm. Additionally, the sunshine duration has shown a decrease in hours, with June experiencing the most significant decrease of 1.28 hours.
Climate Change Data Overview for Penang Island, Malaysia
Explore the comprehensive climate change data for Penang Island, Malaysia. This detailed table provides valuable insights into temperature variations, precipitation levels, and seasonal changes influenced by climate change, helping you understand the unique weather patterns of this region.
Temperature °C
| Month | ⌀ 1940 - 1950 | ⌀ 2013 - 2023 | +/- |
|---|---|---|---|
| Jan | 24.36 | 25.56 | 1.20 |
| Feb | 24.92 | 25.94 | 1.02 |
| Mar | 25.16 | 26.44 | 1.28 |
| Apr | 25.26 | 26.34 | 1.08 |
| May | 25.45 | 26.53 | 1.08 |
| Jun | 25.76 | 26.59 | 0.84 |
| Jul | 25.40 | 26.40 | 1.00 |
| Aug | 25.38 | 26.13 | 0.76 |
| Sep | 24.85 | 25.79 | 0.94 |
| Oct | 24.31 | 25.53 | 1.22 |
| Nov | 24.22 | 25.35 | 1.13 |
| Dec | 24.20 | 25.44 | 1.24 |
| ⌀ Month | 24.94 | 26.00 | 1.07 |
Sunshine (h)
| Month | ⌀ 1940 - 1950 | ⌀ 2013 - 2023 | +/- |
|---|---|---|---|
| Jan | 9.94 | 9.56 | -0.38 |
| Feb | 10.38 | 10.16 | -0.22 |
| Mar | 10.20 | 10.29 | 0.09 |
| Apr | 10.23 | 9.39 | -0.83 |
| May | 10.10 | 8.81 | -1.28 |
| Jun | 10.19 | 9.32 | -0.88 |
| Jul | 10.11 | 9.18 | -0.93 |
| Aug | 9.88 | 9.14 | -0.74 |
| Sep | 8.79 | 8.40 | -0.40 |
| Oct | 8.41 | 7.97 | -0.44 |
| Nov | 9.10 | 7.65 | -1.45 |
| Dec | 9.55 | 8.21 | -1.34 |
| ⌀ Month | 9.74 | 9.01 | -0.73 |
Rain (mm)
| Month | ⌀ 1940 - 1950 | ⌀ 2013 - 2023 | +/- |
|---|---|---|---|
| Jan | 4.41 | 5.07 | 0.65 |
| Feb | 3.89 | 4.42 | 0.53 |
| Mar | 5.42 | 5.41 | -0.01 |
| Apr | 6.52 | 10.16 | 3.64 |
| May | 5.83 | 11.49 | 5.66 |
| Jun | 3.88 | 7.10 | 3.22 |
| Jul | 4.21 | 6.52 | 2.31 |
| Aug | 5.15 | 8.87 | 3.73 |
| Sep | 7.53 | 10.74 | 3.21 |
| Oct | 10.41 | 14.54 | 4.13 |
| Nov | 7.92 | 14.76 | 6.84 |
| Dec | 4.87 | 8.30 | 3.43 |
| ⌀ Month | 5.84 | 8.95 | 3.11 |
Snow (mm)
| Month | ⌀ 1940 - 1950 | ⌀ 2013 - 2023 | +/- |
|---|---|---|---|
| Jan | 0.00 | 0.00 | 0.00 |
| Feb | 0.00 | 0.00 | 0.00 |
| Mar | 0.00 | 0.00 | 0.00 |
| Apr | 0.00 | 0.00 | 0.00 |
| May | 0.00 | 0.00 | 0.00 |
| Jun | 0.00 | 0.00 | 0.00 |
| Jul | 0.00 | 0.00 | 0.00 |
| Aug | 0.00 | 0.00 | 0.00 |
| Sep | 0.00 | 0.00 | 0.00 |
| Oct | 0.00 | 0.00 | 0.00 |
| Nov | 0.00 | 0.00 | 0.00 |
| Dec | 0.00 | 0.00 | 0.00 |
| ⌀ Month | 0.00 | 0.00 | 0.00 |