Climate Change Chart of Pemba Island, Tanzania
Comprehensive Climate Change Chart of Pemba Island, Tanzania: Monthly Averages and Impact Trends
Exploring the changing climate in Pemba Island, Tanzania reveals intriguing insights into temperature, rainfall, and sunshine duration trends over the years.
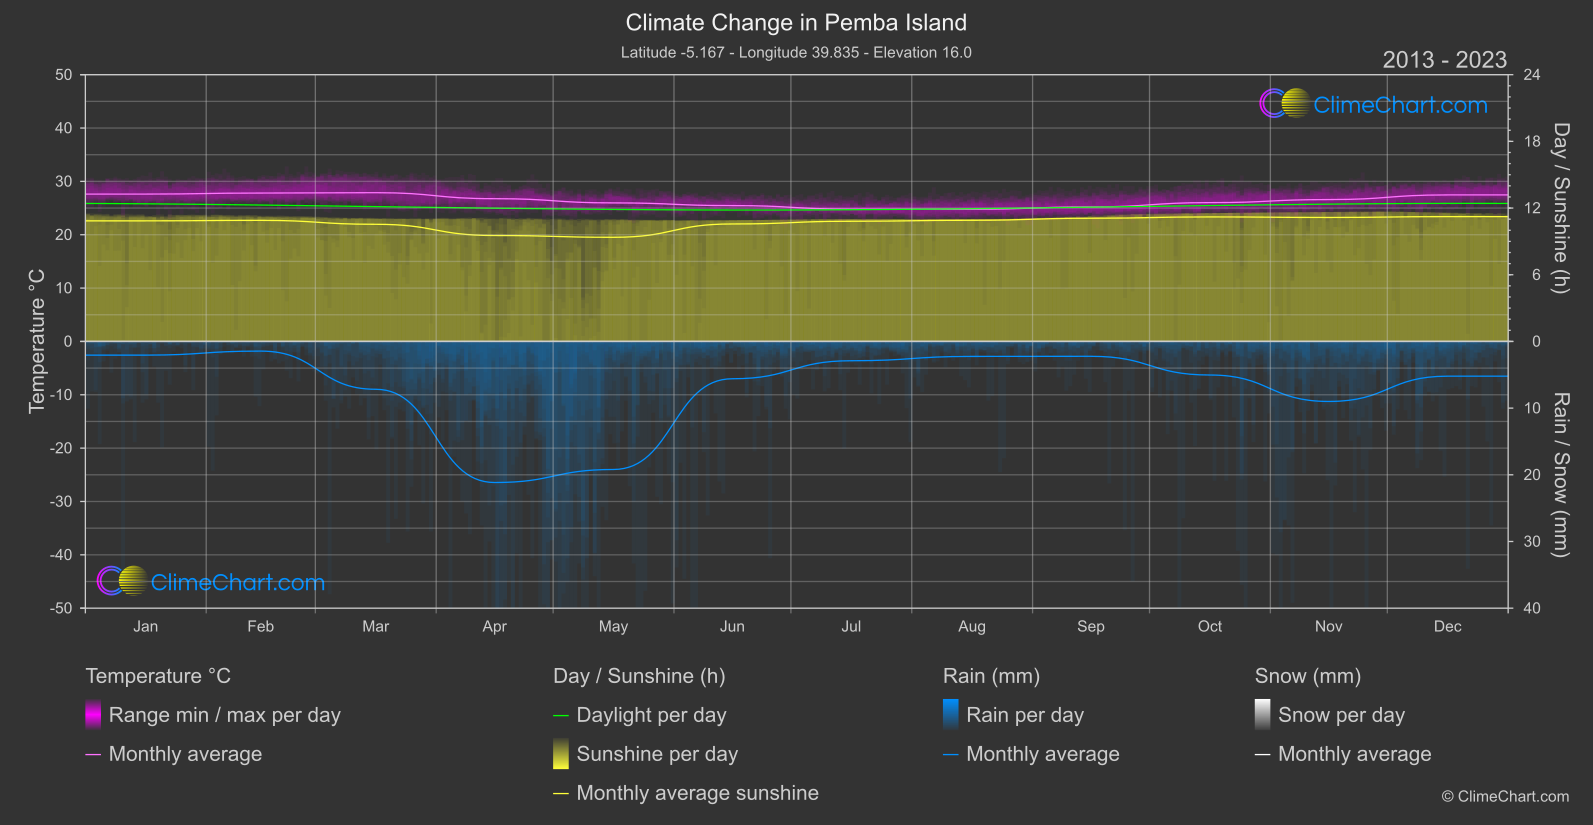
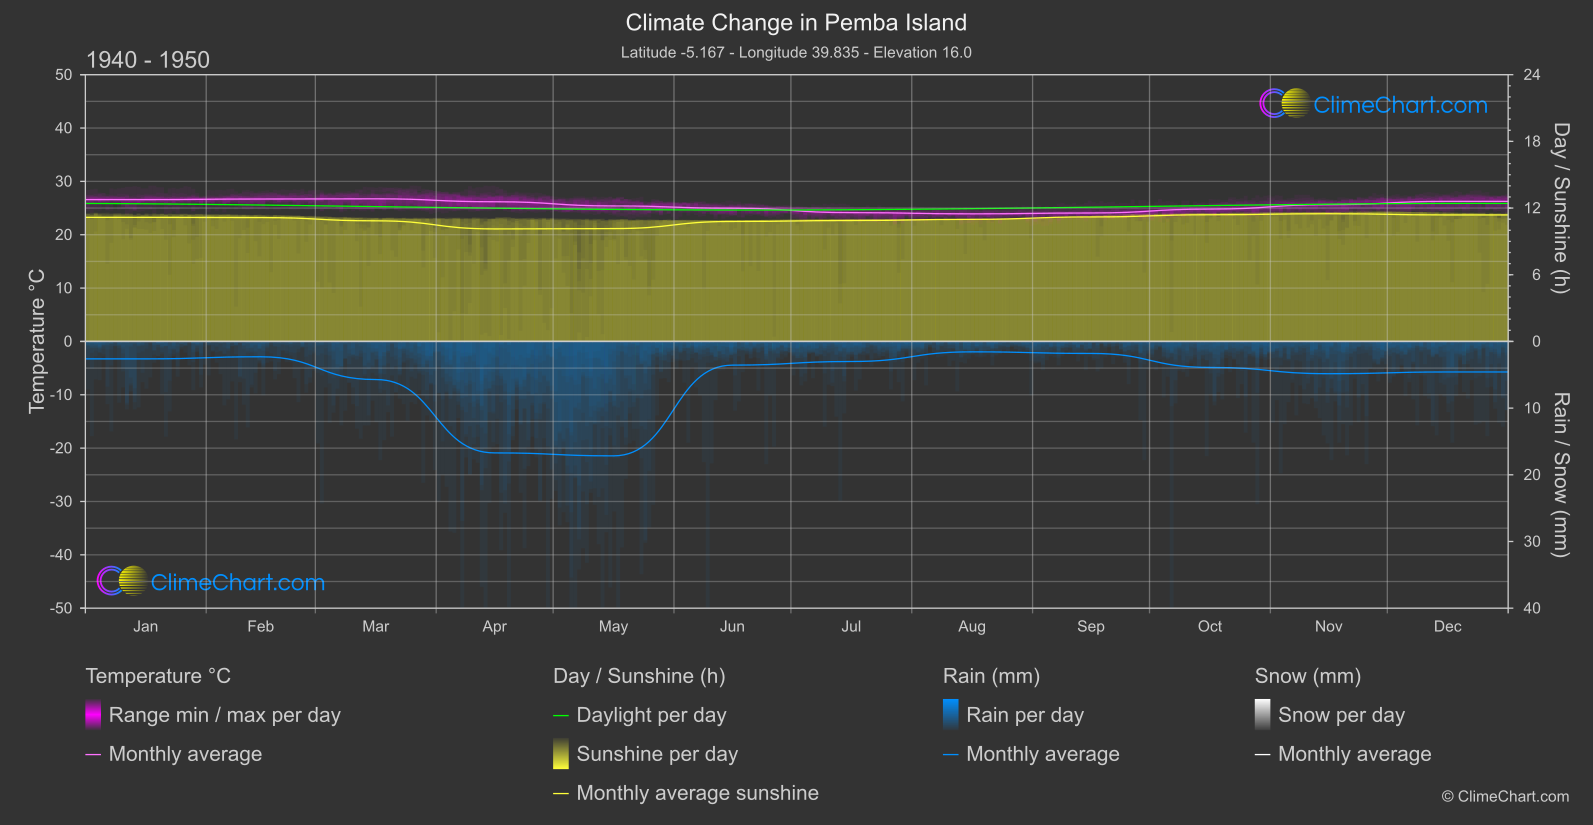
Pemba Island, Tanzania experiences a notable increase in mean temperatures from 1940-1950 to 2013-2024, with September and October showing the highest temperature changes. On the other hand, rainfall patterns exhibit varying trends across different months, with substantial changes observed in April and November. The duration of sunshine also displays fluctuations, with May and June showcasing significant decreases in sunshine hours over the years.
Climate Change Data Overview for Pemba Island, Tanzania
Explore the comprehensive climate change data for Pemba Island, Tanzania. This detailed table provides valuable insights into temperature variations, precipitation levels, and seasonal changes influenced by climate change, helping you understand the unique weather patterns of this region.
Temperature °C
| Month | ⌀ 1940 - 1950 | ⌀ 2013 - 2023 | +/- |
|---|---|---|---|
| Jan | 26.58 | 27.62 | 1.04 |
| Feb | 26.69 | 27.81 | 1.12 |
| Mar | 26.73 | 27.88 | 1.15 |
| Apr | 26.18 | 26.76 | 0.57 |
| May | 25.40 | 25.97 | 0.57 |
| Jun | 24.97 | 25.46 | 0.49 |
| Jul | 24.14 | 24.81 | 0.66 |
| Aug | 23.91 | 24.77 | 0.85 |
| Sep | 24.08 | 25.22 | 1.14 |
| Oct | 24.81 | 26.02 | 1.21 |
| Nov | 25.64 | 26.59 | 0.95 |
| Dec | 26.26 | 27.46 | 1.21 |
| ⌀ Month | 25.45 | 26.36 | 0.91 |
Sunshine (h)
| Month | ⌀ 1940 - 1950 | ⌀ 2013 - 2023 | +/- |
|---|---|---|---|
| Jan | 11.16 | 10.85 | -0.31 |
| Feb | 11.14 | 10.89 | -0.25 |
| Mar | 10.85 | 10.54 | -0.31 |
| Apr | 10.12 | 9.53 | -0.59 |
| May | 10.15 | 9.37 | -0.78 |
| Jun | 10.79 | 10.57 | -0.23 |
| Jul | 10.88 | 10.81 | -0.07 |
| Aug | 10.99 | 10.90 | -0.08 |
| Sep | 11.20 | 11.08 | -0.12 |
| Oct | 11.40 | 11.20 | -0.19 |
| Nov | 11.49 | 11.15 | -0.34 |
| Dec | 11.38 | 11.23 | -0.15 |
| ⌀ Month | 10.96 | 10.68 | -0.29 |
Rain (mm)
| Month | ⌀ 1940 - 1950 | ⌀ 2013 - 2023 | +/- |
|---|---|---|---|
| Jan | 1.31 | 1.03 | -0.28 |
| Feb | 1.15 | 0.72 | -0.43 |
| Mar | 2.86 | 3.59 | 0.73 |
| Apr | 8.36 | 10.58 | 2.22 |
| May | 8.58 | 9.60 | 1.02 |
| Jun | 1.78 | 2.80 | 1.02 |
| Jul | 1.50 | 1.45 | -0.06 |
| Aug | 0.78 | 1.12 | 0.34 |
| Sep | 0.90 | 1.12 | 0.22 |
| Oct | 1.95 | 2.52 | 0.57 |
| Nov | 2.42 | 4.50 | 2.08 |
| Dec | 2.29 | 2.60 | 0.32 |
| ⌀ Month | 2.82 | 3.47 | 0.65 |
Snow (mm)
| Month | ⌀ 1940 - 1950 | ⌀ 2013 - 2023 | +/- |
|---|---|---|---|
| Jan | 0.00 | 0.00 | 0.00 |
| Feb | 0.00 | 0.00 | 0.00 |
| Mar | 0.00 | 0.00 | 0.00 |
| Apr | 0.00 | 0.00 | 0.00 |
| May | 0.00 | 0.00 | 0.00 |
| Jun | 0.00 | 0.00 | 0.00 |
| Jul | 0.00 | 0.00 | 0.00 |
| Aug | 0.00 | 0.00 | 0.00 |
| Sep | 0.00 | 0.00 | 0.00 |
| Oct | 0.00 | 0.00 | 0.00 |
| Nov | 0.00 | 0.00 | 0.00 |
| Dec | 0.00 | 0.00 | 0.00 |
| ⌀ Month | 0.00 | 0.00 | 0.00 |