Climate Change Chart of Paramaribo, Suriname
Comprehensive Climate Change Chart of Paramaribo, Suriname: Monthly Averages and Impact Trends
Explore the climate change data for Paramaribo, Suriname, showcasing the temperature, rainfall, and sunshine duration trends over the years. Gain insights into the changing climate patterns in this region.
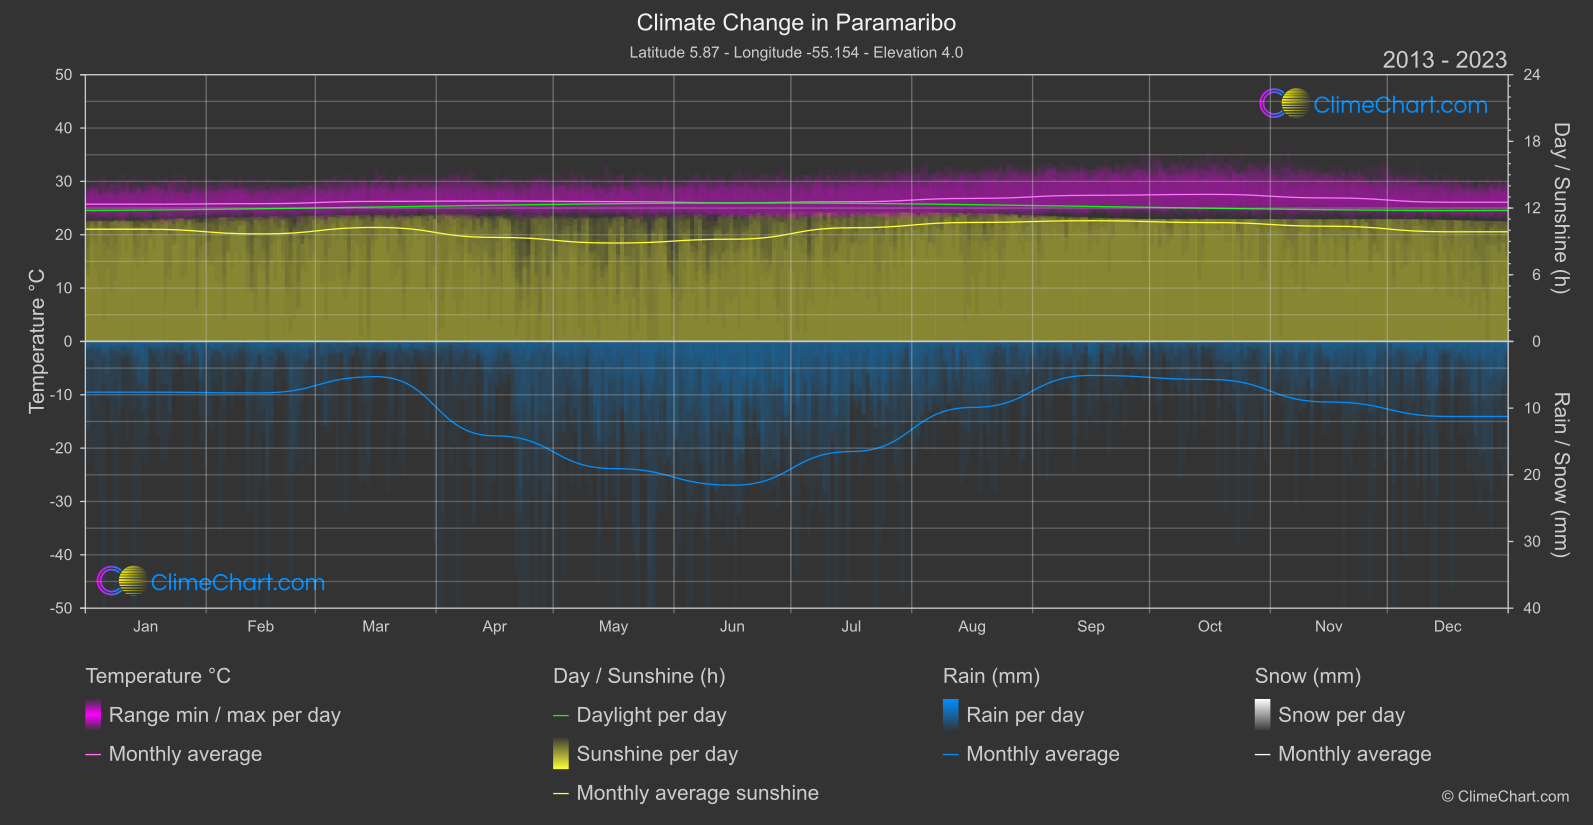
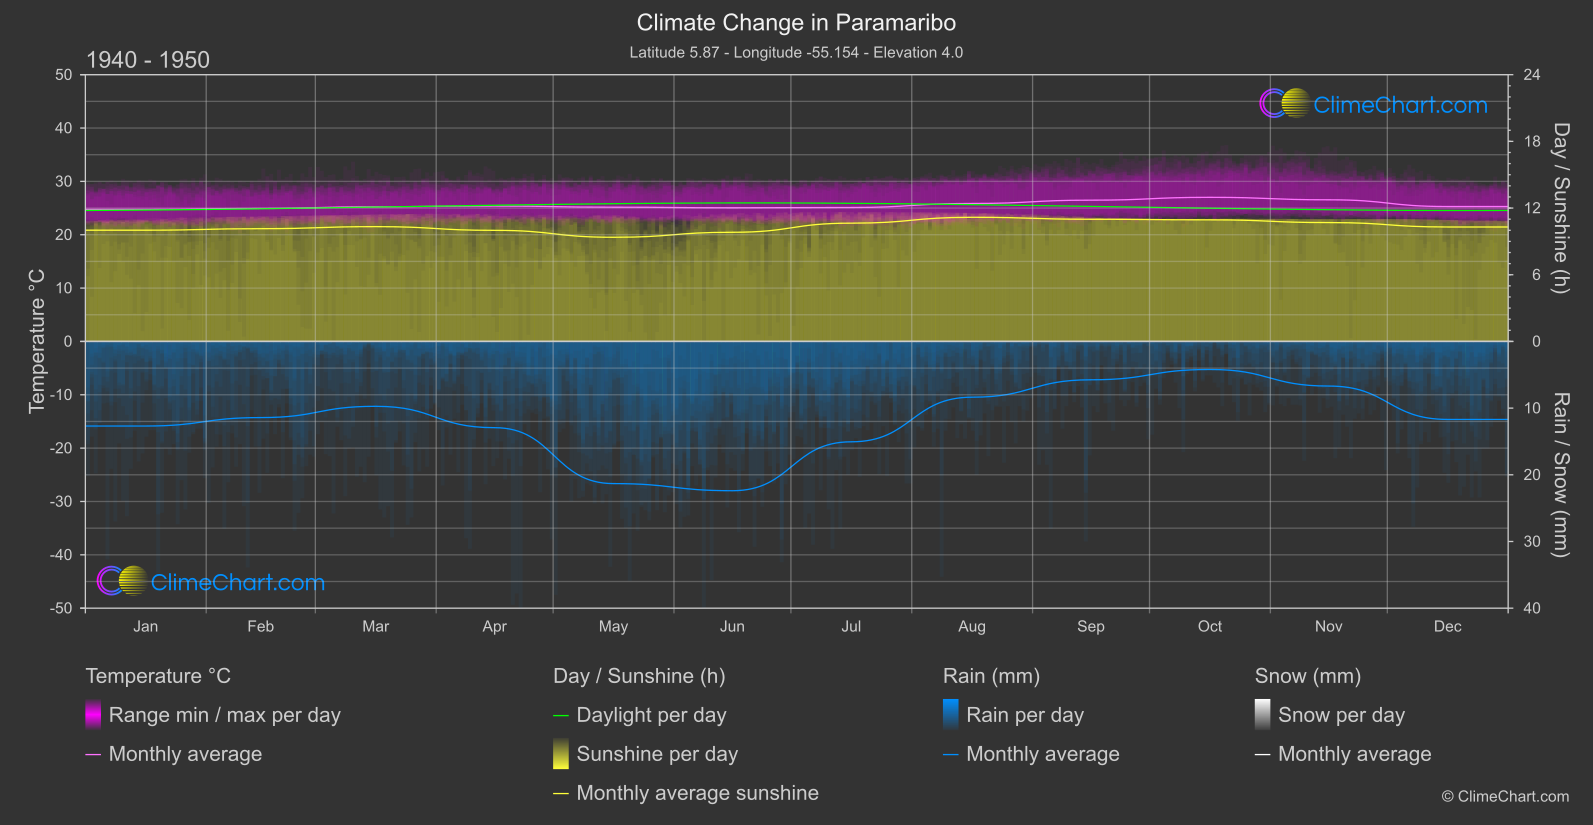
Paramaribo, the capital of Suriname, experiences notable climate changes reflected in temperature, rainfall, and sunshine duration. Analyzing the data, we observe that the month with the highest temperature change is July, with a significant increase of 1.08°C compared to the past decades. Conversely, the month with the largest decrease in rainfall is March, showing a reduction of 2.22 mm. Sunshine duration also exhibits variations, with the largest decrease in December, indicating a decline of 0.43 hours.
Climate Change Data Overview for Paramaribo, Suriname
Explore the comprehensive climate change data for Paramaribo, Suriname. This detailed table provides valuable insights into temperature variations, precipitation levels, and seasonal changes influenced by climate change, helping you understand the unique weather patterns of this region.
Temperature °C
| Month | ⌀ 1940 - 1950 | ⌀ 2013 - 2023 | +/- |
|---|---|---|---|
| Jan | 24.75 | 25.72 | 0.97 |
| Feb | 24.93 | 25.83 | 0.90 |
| Mar | 25.25 | 26.25 | 1.00 |
| Apr | 25.38 | 26.33 | 0.95 |
| May | 25.16 | 26.21 | 1.05 |
| Jun | 25.05 | 25.98 | 0.93 |
| Jul | 25.11 | 26.19 | 1.08 |
| Aug | 25.86 | 26.81 | 0.95 |
| Sep | 26.48 | 27.39 | 0.91 |
| Oct | 27.01 | 27.57 | 0.56 |
| Nov | 26.55 | 26.90 | 0.35 |
| Dec | 25.29 | 26.09 | 0.81 |
| ⌀ Month | 25.57 | 26.44 | 0.87 |
Sunshine (h)
| Month | ⌀ 1940 - 1950 | ⌀ 2013 - 2023 | +/- |
|---|---|---|---|
| Jan | 10.01 | 10.10 | 0.09 |
| Feb | 10.14 | 9.67 | -0.47 |
| Mar | 10.33 | 10.26 | -0.07 |
| Apr | 9.99 | 9.36 | -0.63 |
| May | 9.37 | 8.85 | -0.52 |
| Jun | 9.82 | 9.20 | -0.62 |
| Jul | 10.64 | 10.23 | -0.41 |
| Aug | 11.17 | 10.70 | -0.46 |
| Sep | 10.99 | 10.86 | -0.13 |
| Oct | 10.94 | 10.69 | -0.25 |
| Nov | 10.69 | 10.37 | -0.33 |
| Dec | 10.30 | 9.87 | -0.43 |
| ⌀ Month | 10.37 | 10.01 | -0.35 |
Rain (mm)
| Month | ⌀ 1940 - 1950 | ⌀ 2013 - 2023 | +/- |
|---|---|---|---|
| Jan | 6.34 | 3.80 | -2.54 |
| Feb | 5.71 | 3.86 | -1.85 |
| Mar | 4.86 | 2.64 | -2.22 |
| Apr | 6.47 | 7.08 | 0.61 |
| May | 10.66 | 9.53 | -1.13 |
| Jun | 11.19 | 10.78 | -0.41 |
| Jul | 7.53 | 8.26 | 0.73 |
| Aug | 4.18 | 4.95 | 0.77 |
| Sep | 2.88 | 2.55 | -0.33 |
| Oct | 2.10 | 2.85 | 0.75 |
| Nov | 3.35 | 4.54 | 1.20 |
| Dec | 5.85 | 5.62 | -0.23 |
| ⌀ Month | 5.93 | 5.54 | -0.39 |
Snow (mm)
| Month | ⌀ 1940 - 1950 | ⌀ 2013 - 2023 | +/- |
|---|---|---|---|
| Jan | 0.00 | 0.00 | 0.00 |
| Feb | 0.00 | 0.00 | 0.00 |
| Mar | 0.00 | 0.00 | 0.00 |
| Apr | 0.00 | 0.00 | 0.00 |
| May | 0.00 | 0.00 | 0.00 |
| Jun | 0.00 | 0.00 | 0.00 |
| Jul | 0.00 | 0.00 | 0.00 |
| Aug | 0.00 | 0.00 | 0.00 |
| Sep | 0.00 | 0.00 | 0.00 |
| Oct | 0.00 | 0.00 | 0.00 |
| Nov | 0.00 | 0.00 | 0.00 |
| Dec | 0.00 | 0.00 | 0.00 |
| ⌀ Month | 0.00 | 0.00 | 0.00 |