Climate Change Chart of Pago Pago, American Samoa
Comprehensive Climate Change Chart of Pago Pago, American Samoa: Monthly Averages and Impact Trends
Exploring the climate change in Pago Pago, American Samoa reveals intriguing insights into temperature, rainfall, and sunshine duration trends over the years.
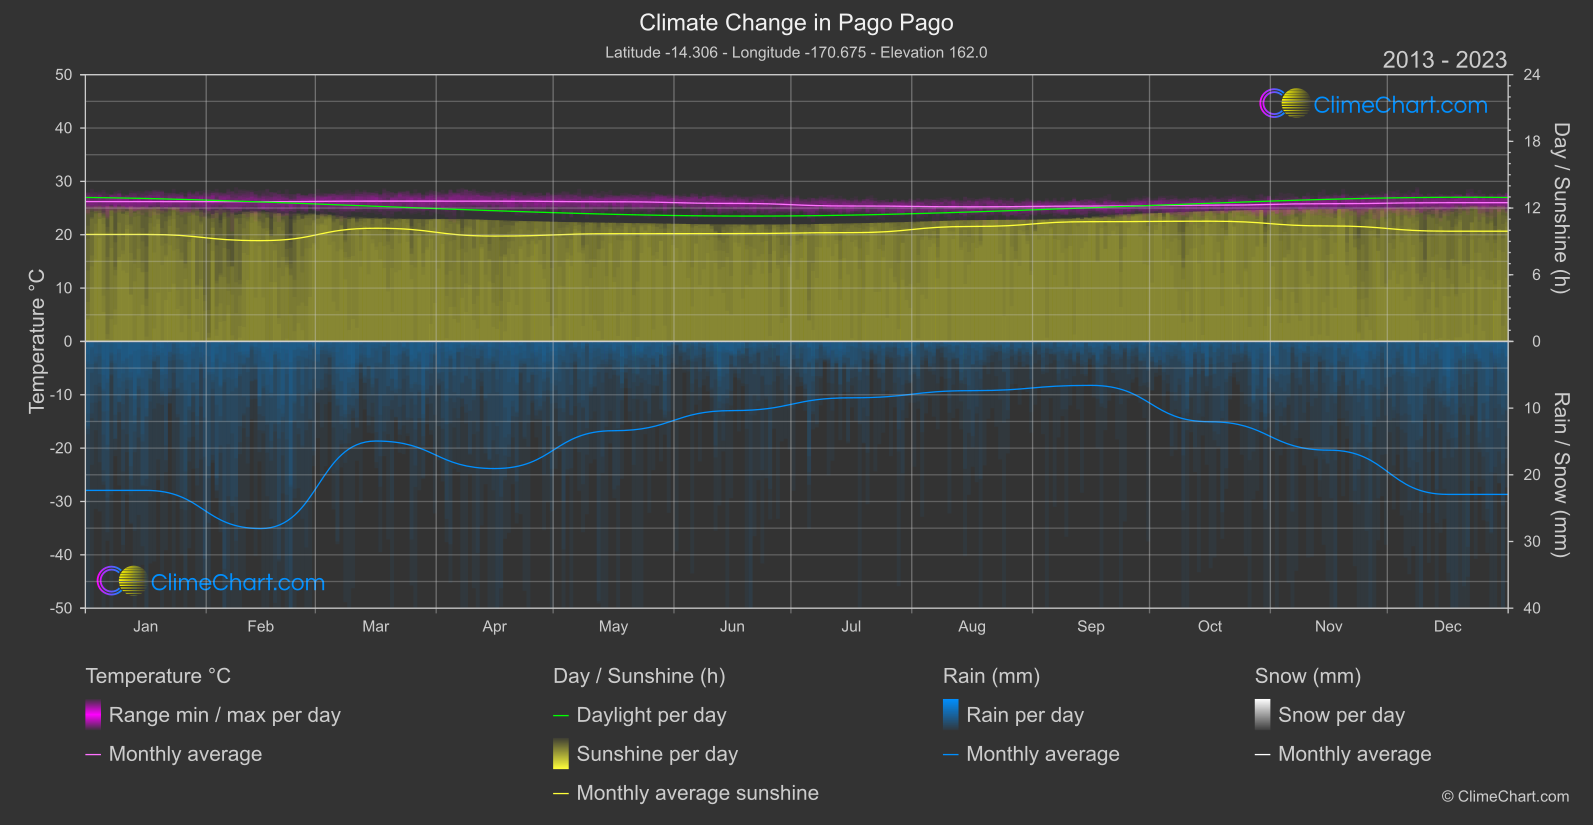
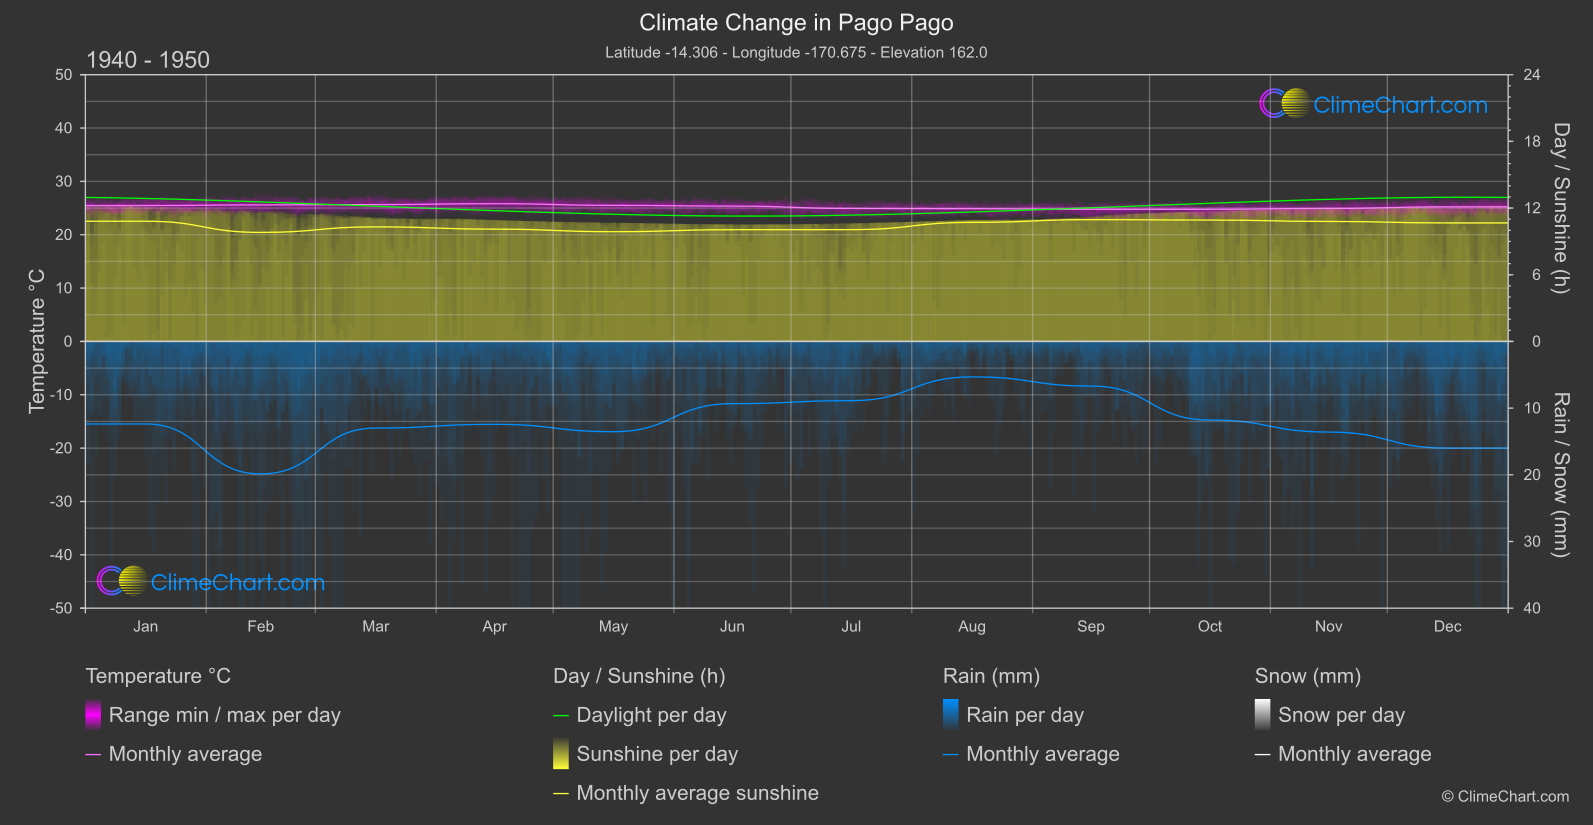
Pago Pago, American Samoa, has experienced noticeable changes in its climate over the years. Analyzing the temperature data from 1940-1950 compared to 2013-2024, it is evident that the month with the highest temperature change is November, with an increase of 0.887°C. In terms of rainfall, December stands out with a significant increase of 3.468 mm. Additionally, the sunshine duration has shown variations, with January experiencing the highest decrease of 1.188 hours.
Climate Change Data Overview for Pago Pago, American Samoa
Explore the comprehensive climate change data for Pago Pago, American Samoa. This detailed table provides valuable insights into temperature variations, precipitation levels, and seasonal changes influenced by climate change, helping you understand the unique weather patterns of this region.
Temperature °C
| Month | ⌀ 1940 - 1950 | ⌀ 2013 - 2023 | +/- |
|---|---|---|---|
| Jan | 25.47 | 26.22 | 0.75 |
| Feb | 25.59 | 26.19 | 0.61 |
| Mar | 25.65 | 26.30 | 0.65 |
| Apr | 25.82 | 26.29 | 0.47 |
| May | 25.51 | 26.18 | 0.67 |
| Jun | 25.37 | 25.87 | 0.50 |
| Jul | 24.93 | 25.39 | 0.46 |
| Aug | 24.88 | 25.24 | 0.36 |
| Sep | 24.76 | 25.37 | 0.61 |
| Oct | 24.76 | 25.54 | 0.78 |
| Nov | 24.93 | 25.82 | 0.89 |
| Dec | 25.23 | 26.01 | 0.78 |
| ⌀ Month | 25.24 | 25.87 | 0.63 |
Sunshine (h)
| Month | ⌀ 1940 - 1950 | ⌀ 2013 - 2023 | +/- |
|---|---|---|---|
| Jan | 10.82 | 9.63 | -1.19 |
| Feb | 9.81 | 9.07 | -0.74 |
| Mar | 10.31 | 10.18 | -0.12 |
| Apr | 10.10 | 9.48 | -0.62 |
| May | 9.87 | 9.69 | -0.18 |
| Jun | 10.05 | 9.70 | -0.35 |
| Jul | 10.06 | 9.79 | -0.27 |
| Aug | 10.71 | 10.34 | -0.37 |
| Sep | 10.96 | 10.78 | -0.18 |
| Oct | 10.92 | 10.82 | -0.10 |
| Nov | 10.80 | 10.39 | -0.41 |
| Dec | 10.66 | 9.92 | -0.74 |
| ⌀ Month | 10.42 | 9.98 | -0.44 |
Rain (mm)
| Month | ⌀ 1940 - 1950 | ⌀ 2013 - 2023 | +/- |
|---|---|---|---|
| Jan | 6.19 | 11.17 | 4.98 |
| Feb | 9.93 | 14.03 | 4.10 |
| Mar | 6.50 | 7.47 | 0.97 |
| Apr | 6.21 | 9.53 | 3.32 |
| May | 6.77 | 6.69 | -0.07 |
| Jun | 4.67 | 5.19 | 0.52 |
| Jul | 4.44 | 4.23 | -0.21 |
| Aug | 2.66 | 3.69 | 1.03 |
| Sep | 3.35 | 3.29 | -0.05 |
| Oct | 5.89 | 6.02 | 0.13 |
| Nov | 6.79 | 8.15 | 1.36 |
| Dec | 8.00 | 11.47 | 3.47 |
| ⌀ Month | 5.95 | 7.58 | 1.63 |
Snow (mm)
| Month | ⌀ 1940 - 1950 | ⌀ 2013 - 2023 | +/- |
|---|---|---|---|
| Jan | 0.00 | 0.00 | 0.00 |
| Feb | 0.00 | 0.00 | 0.00 |
| Mar | 0.00 | 0.00 | 0.00 |
| Apr | 0.00 | 0.00 | 0.00 |
| May | 0.00 | 0.00 | 0.00 |
| Jun | 0.00 | 0.00 | 0.00 |
| Jul | 0.00 | 0.00 | 0.00 |
| Aug | 0.00 | 0.00 | 0.00 |
| Sep | 0.00 | 0.00 | 0.00 |
| Oct | 0.00 | 0.00 | 0.00 |
| Nov | 0.00 | 0.00 | 0.00 |
| Dec | 0.00 | 0.00 | 0.00 |
| ⌀ Month | 0.00 | 0.00 | 0.00 |