Climate Change Chart of Olympia, USA
Comprehensive Climate Change Chart of Olympia, USA: Monthly Averages and Impact Trends
Discover the changing climate trends in Olympia, USA, through insightful data comparisons. Explore how temperature, rainfall, snowfall, and sunshine have evolved from 1940 to 1950 compared to 2013 to 2024.
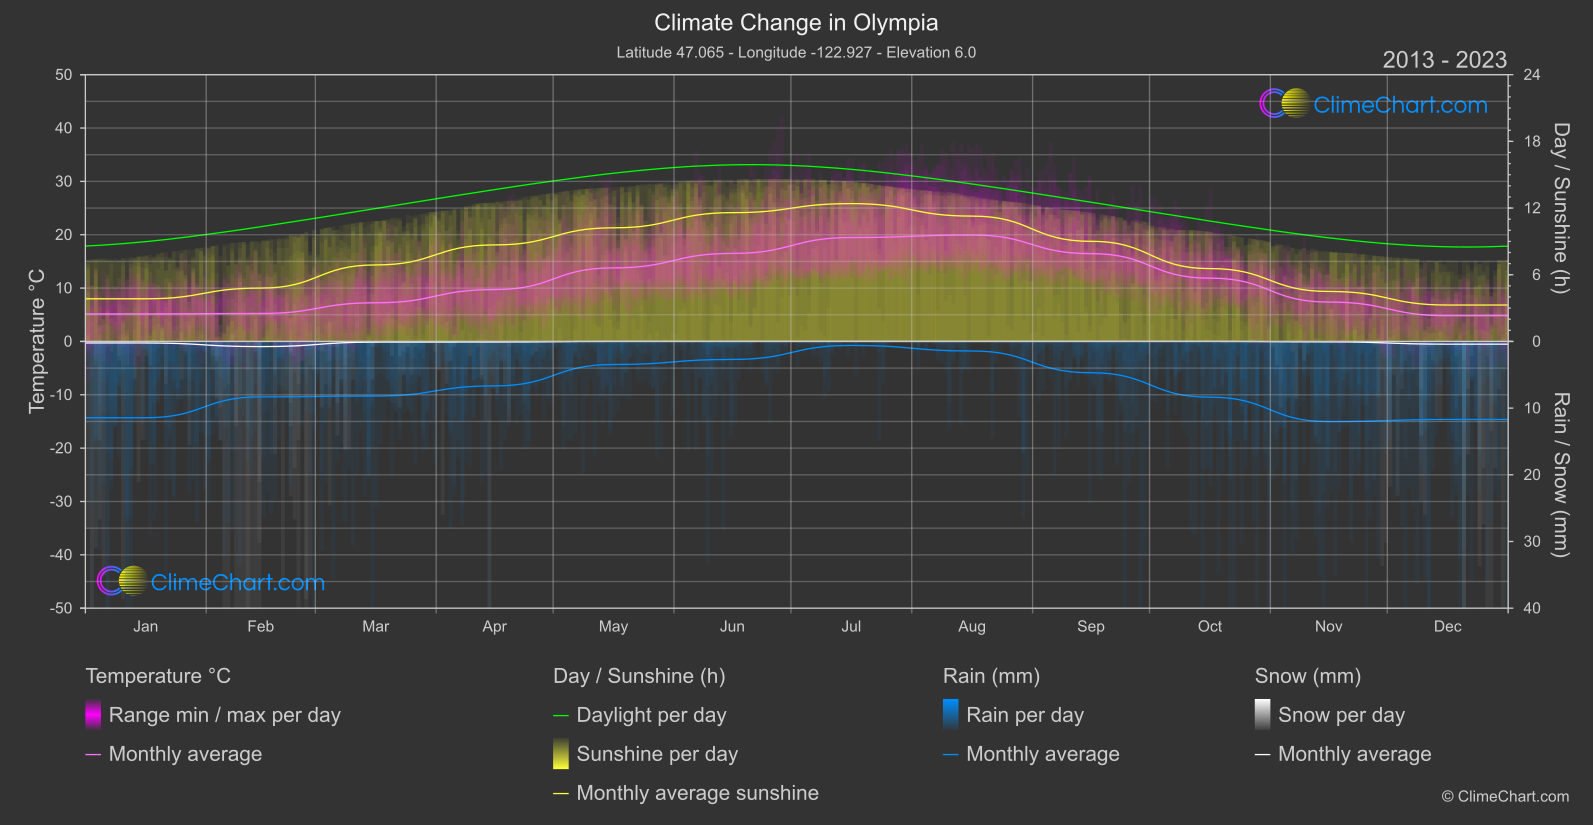
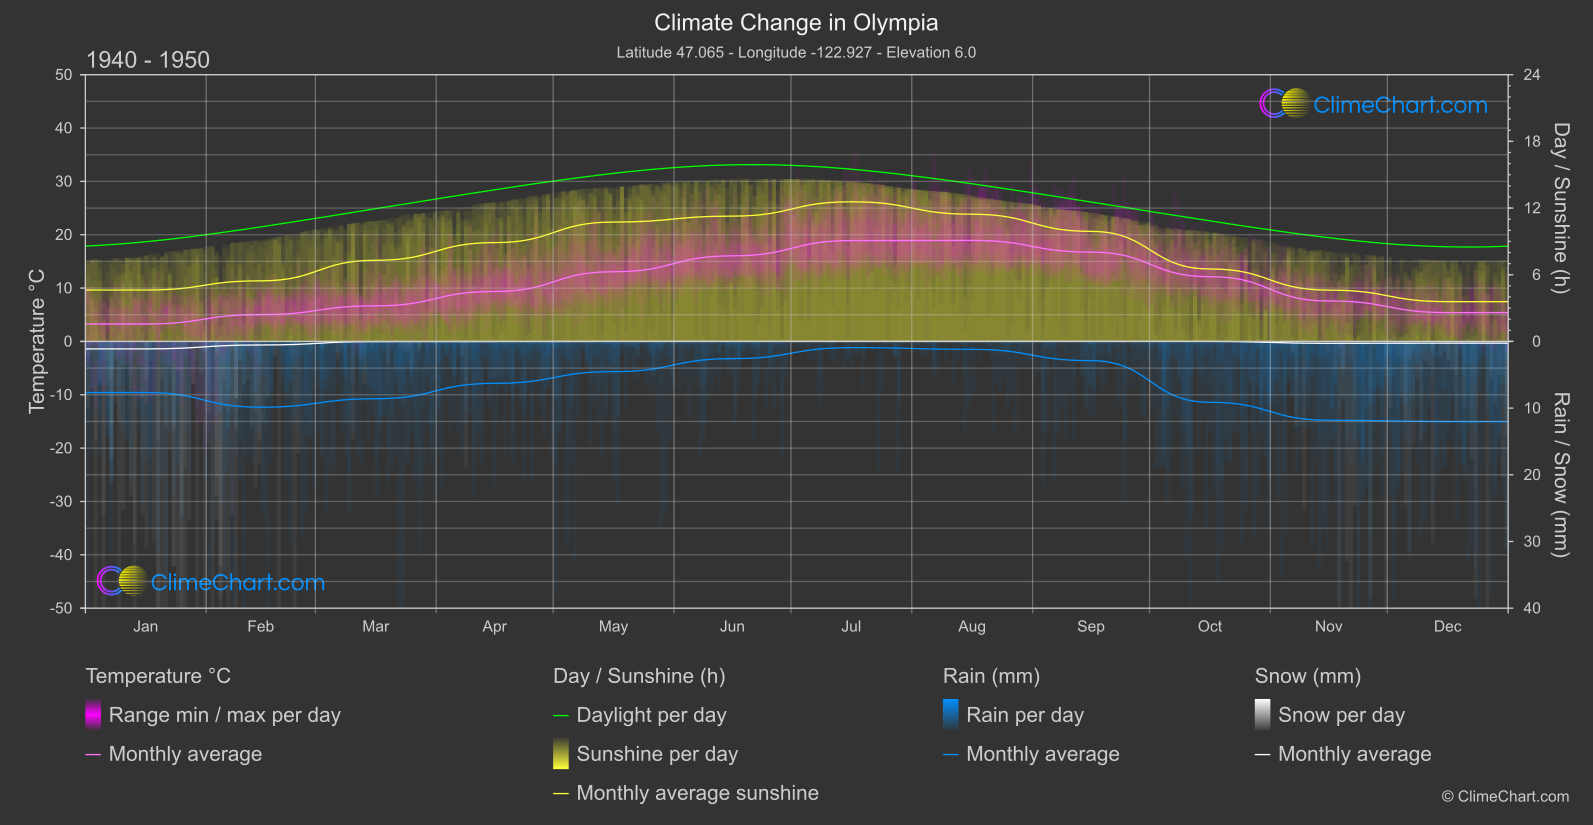
Olympia, USA, has witnessed significant climate changes over the years. Comparing temperature data from January to December between 1940 - 1950 and 2013 - 2024, it's evident that the month with the highest temperature change is August, with an increase of 1.02°C. On the other hand, September experienced a slight decrease of -0.29°C in temperature. When looking at rainfall patterns, January saw the most significant increase in precipitation by 1.89mm, while February had a decrease of -0.78mm. Snowfall remained relatively stable over the years, with minimal changes. Sunshine duration fluctuated throughout the months, with the most significant decrease in sunshine hours observed in September at -0.90 hours.
Climate Change Data Overview for Olympia, USA
Explore the comprehensive climate change data for Olympia, USA. This detailed table provides valuable insights into temperature variations, precipitation levels, and seasonal changes influenced by climate change, helping you understand the unique weather patterns of this region.
Temperature °C
| Month | ⌀ 1940 - 1950 | ⌀ 2013 - 2023 | +/- |
|---|---|---|---|
| Jan | 3.27 | 5.16 | 1.89 |
| Feb | 5.02 | 5.24 | 0.22 |
| Mar | 6.67 | 7.25 | 0.57 |
| Apr | 9.36 | 9.72 | 0.35 |
| May | 13.06 | 13.79 | 0.72 |
| Jun | 16.04 | 16.50 | 0.45 |
| Jul | 18.91 | 19.47 | 0.57 |
| Aug | 18.93 | 19.95 | 1.02 |
| Sep | 16.75 | 16.46 | -0.29 |
| Oct | 12.13 | 11.86 | -0.27 |
| Nov | 7.58 | 7.38 | -0.20 |
| Dec | 5.41 | 4.82 | -0.58 |
| ⌀ Month | 11.09 | 11.47 | 0.37 |
Sunshine (h)
| Month | ⌀ 1940 - 1950 | ⌀ 2013 - 2023 | +/- |
|---|---|---|---|
| Jan | 4.62 | 3.84 | -0.79 |
| Feb | 5.45 | 4.80 | -0.65 |
| Mar | 7.30 | 6.88 | -0.42 |
| Apr | 8.89 | 8.68 | -0.21 |
| May | 10.74 | 10.22 | -0.52 |
| Jun | 11.28 | 11.59 | 0.31 |
| Jul | 12.56 | 12.40 | -0.16 |
| Aug | 11.45 | 11.28 | -0.17 |
| Sep | 9.90 | 9.01 | -0.90 |
| Oct | 6.52 | 6.56 | 0.04 |
| Nov | 4.62 | 4.50 | -0.12 |
| Dec | 3.58 | 3.27 | -0.30 |
| ⌀ Month | 8.08 | 7.75 | -0.32 |
Rain (mm)
| Month | ⌀ 1940 - 1950 | ⌀ 2013 - 2023 | +/- |
|---|---|---|---|
| Jan | 3.83 | 5.72 | 1.89 |
| Feb | 4.93 | 4.16 | -0.78 |
| Mar | 4.30 | 4.09 | -0.20 |
| Apr | 3.14 | 3.33 | 0.19 |
| May | 2.26 | 1.73 | -0.54 |
| Jun | 1.29 | 1.35 | 0.06 |
| Jul | 0.47 | 0.30 | -0.17 |
| Aug | 0.59 | 0.72 | 0.13 |
| Sep | 1.44 | 2.35 | 0.91 |
| Oct | 4.56 | 4.18 | -0.38 |
| Nov | 5.91 | 6.01 | 0.11 |
| Dec | 6.01 | 5.85 | -0.16 |
| ⌀ Month | 3.23 | 3.32 | 0.09 |
Snow (mm)
| Month | ⌀ 1940 - 1950 | ⌀ 2013 - 2023 | +/- |
|---|---|---|---|
| Jan | 0.56 | 0.12 | -0.44 |
| Feb | 0.27 | 0.39 | 0.12 |
| Mar | 0.01 | 0.05 | 0.04 |
| Apr | 0.01 | 0.04 | 0.04 |
| May | 0.00 | 0.00 | 0.00 |
| Jun | 0.00 | 0.00 | 0.00 |
| Jul | 0.00 | 0.00 | 0.00 |
| Aug | 0.00 | 0.00 | 0.00 |
| Sep | 0.00 | 0.00 | 0.00 |
| Oct | 0.00 | 0.00 | -0.00 |
| Nov | 0.14 | 0.03 | -0.11 |
| Dec | 0.13 | 0.20 | 0.08 |
| ⌀ Month | 0.09 | 0.07 | -0.02 |