Climate Change Chart of Oklahoma City, USA
Comprehensive Climate Change Chart of Oklahoma City, USA: Monthly Averages and Impact Trends
Exploring the climate changes in Oklahoma City, USA
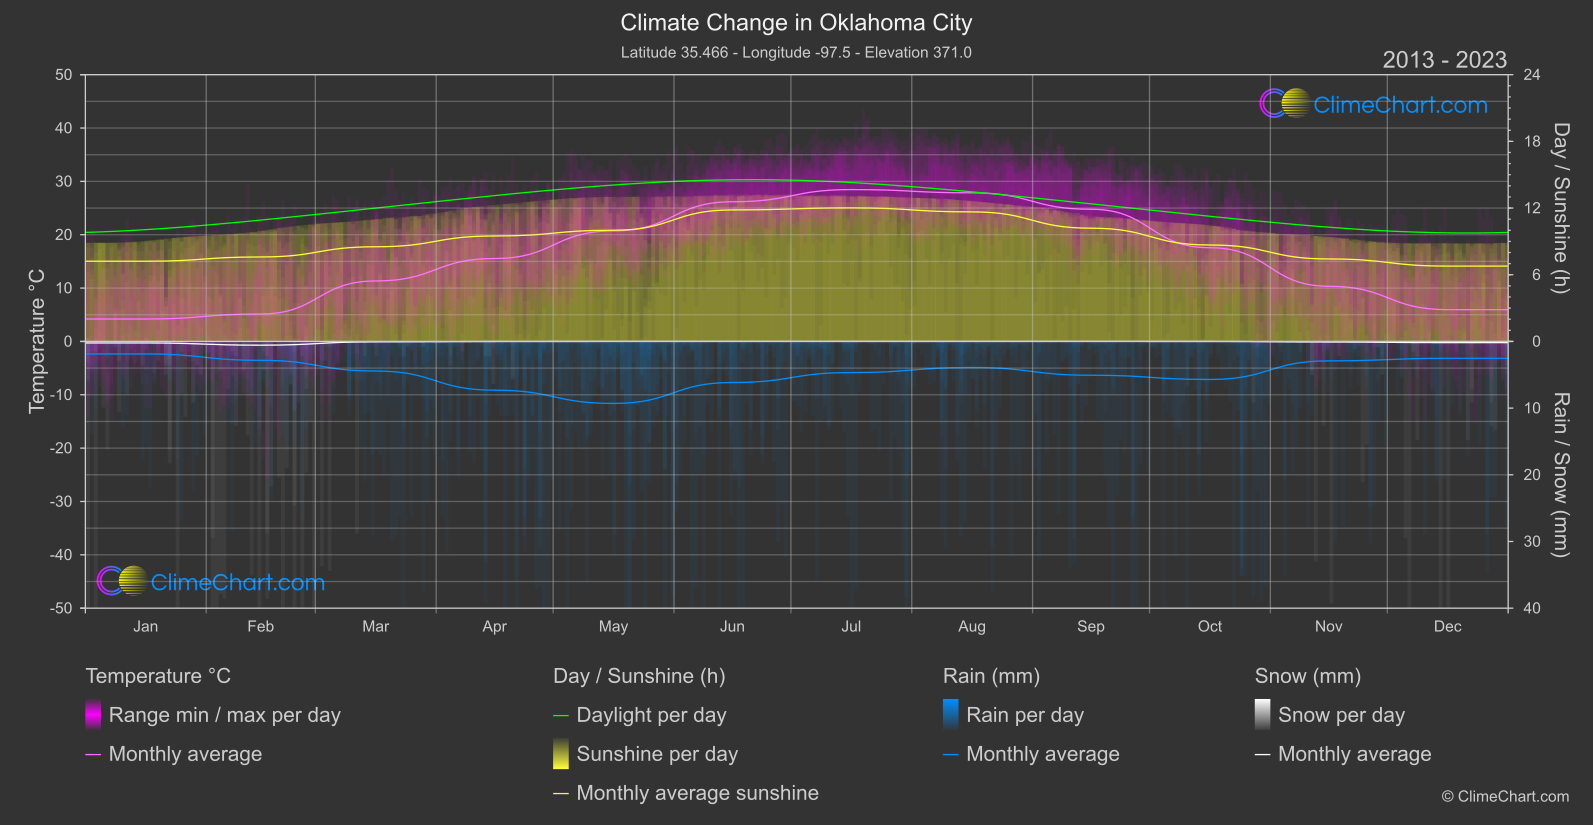
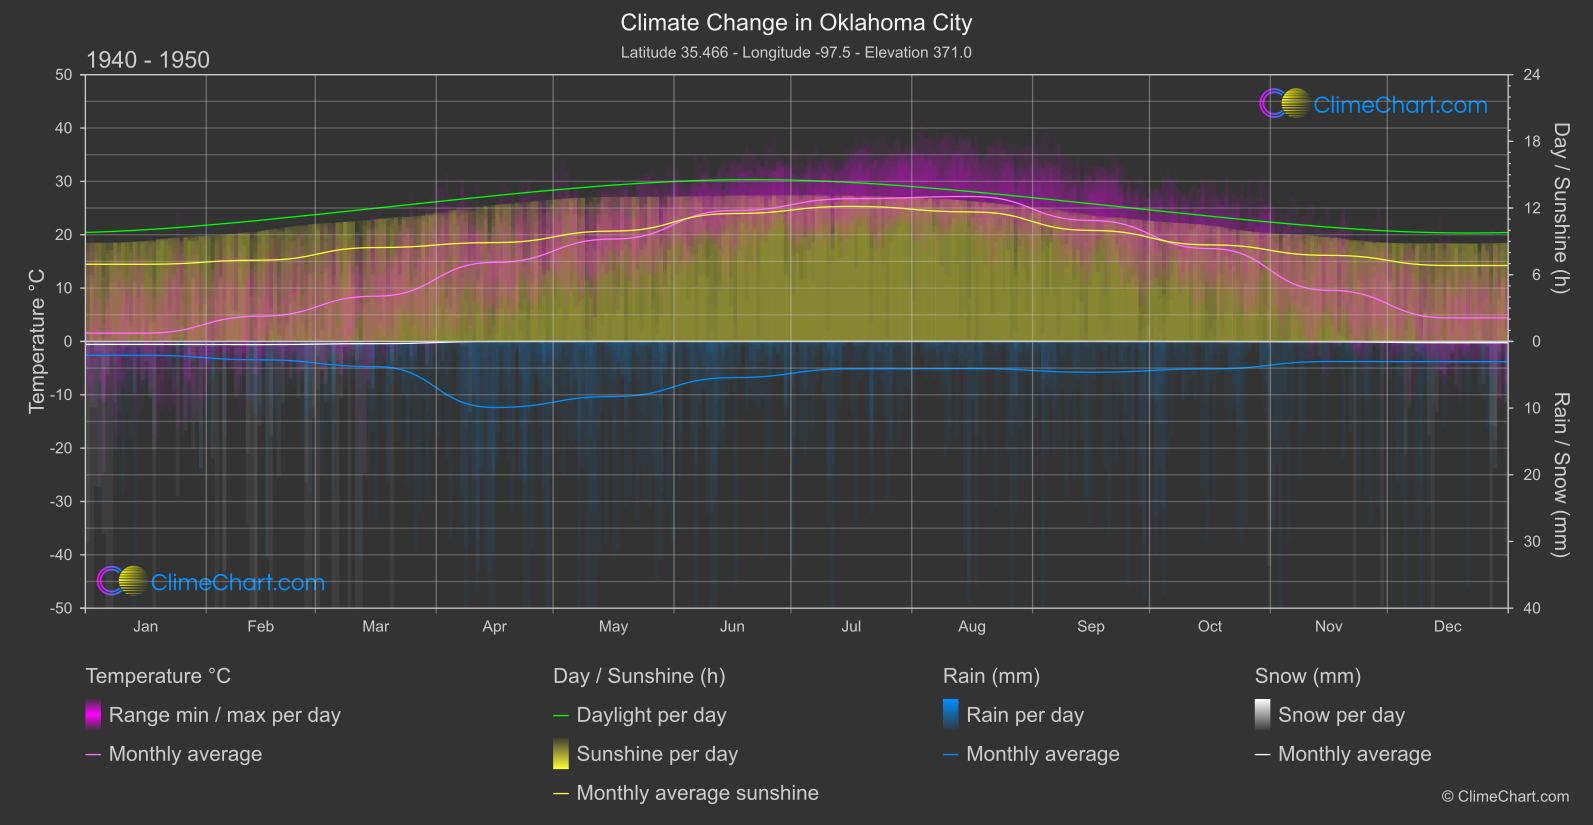
Oklahoma City, USA, has experienced noticeable changes in temperature, rainfall, snowfall, and sunshine duration over the years. Analyzing the data from 1940 - 1950 compared to 2013 - 2024 reveals interesting insights. For instance, September shows a significant increase in temperature with a change of 2.109°C, while April has experienced a decrease in rainfall by 1.296mm. The sunshine duration in June saw a notable rise of 0.326 hours. These changes reflect the impact of climate change on the weather patterns in Oklahoma City.
Climate Change Data Overview for Oklahoma City, USA
Explore the comprehensive climate change data for Oklahoma City, USA. This detailed table provides valuable insights into temperature variations, precipitation levels, and seasonal changes influenced by climate change, helping you understand the unique weather patterns of this region.
Temperature °C
| Month | ⌀ 1940 - 1950 | ⌀ 2013 - 2023 | +/- |
|---|---|---|---|
| Jan | 1.56 | 4.20 | 2.65 |
| Feb | 4.74 | 5.14 | 0.41 |
| Mar | 8.48 | 11.33 | 2.85 |
| Apr | 14.82 | 15.55 | 0.73 |
| May | 19.20 | 20.72 | 1.52 |
| Jun | 24.52 | 26.18 | 1.66 |
| Jul | 26.76 | 28.46 | 1.70 |
| Aug | 27.16 | 27.86 | 0.69 |
| Sep | 22.66 | 24.77 | 2.11 |
| Oct | 17.40 | 17.56 | 0.16 |
| Nov | 9.57 | 10.34 | 0.77 |
| Dec | 4.41 | 5.95 | 1.54 |
| ⌀ Month | 15.11 | 16.51 | 1.40 |
Sunshine (h)
| Month | ⌀ 1940 - 1950 | ⌀ 2013 - 2023 | +/- |
|---|---|---|---|
| Jan | 6.94 | 7.21 | 0.27 |
| Feb | 7.31 | 7.60 | 0.29 |
| Mar | 8.45 | 8.52 | 0.07 |
| Apr | 8.89 | 9.49 | 0.59 |
| May | 9.93 | 10.01 | 0.08 |
| Jun | 11.51 | 11.83 | 0.33 |
| Jul | 12.15 | 12.02 | -0.13 |
| Aug | 11.65 | 11.65 | 0.00 |
| Sep | 9.99 | 10.19 | 0.20 |
| Oct | 8.68 | 8.68 | -0.01 |
| Nov | 7.74 | 7.42 | -0.32 |
| Dec | 6.83 | 6.78 | -0.05 |
| ⌀ Month | 9.17 | 9.28 | 0.11 |
Rain (mm)
| Month | ⌀ 1940 - 1950 | ⌀ 2013 - 2023 | +/- |
|---|---|---|---|
| Jan | 1.04 | 0.94 | -0.10 |
| Feb | 1.38 | 1.42 | 0.04 |
| Mar | 1.89 | 2.22 | 0.33 |
| Apr | 4.95 | 3.66 | -1.30 |
| May | 4.13 | 4.65 | 0.52 |
| Jun | 2.71 | 3.08 | 0.37 |
| Jul | 2.06 | 2.33 | 0.28 |
| Aug | 2.04 | 1.96 | -0.08 |
| Sep | 2.31 | 2.54 | 0.22 |
| Oct | 2.06 | 2.85 | 0.80 |
| Nov | 1.51 | 1.46 | -0.05 |
| Dec | 1.52 | 1.26 | -0.25 |
| ⌀ Month | 2.30 | 2.36 | 0.06 |
Snow (mm)
| Month | ⌀ 1940 - 1950 | ⌀ 2013 - 2023 | +/- |
|---|---|---|---|
| Jan | 0.22 | 0.11 | -0.11 |
| Feb | 0.23 | 0.28 | 0.04 |
| Mar | 0.17 | 0.03 | -0.13 |
| Apr | 0.00 | 0.01 | 0.00 |
| May | 0.00 | 0.00 | 0.00 |
| Jun | 0.00 | 0.00 | 0.00 |
| Jul | 0.00 | 0.00 | 0.00 |
| Aug | 0.00 | 0.00 | 0.00 |
| Sep | 0.00 | 0.00 | 0.00 |
| Oct | 0.01 | 0.00 | -0.01 |
| Nov | 0.03 | 0.04 | 0.01 |
| Dec | 0.10 | 0.09 | -0.01 |
| ⌀ Month | 0.06 | 0.05 | -0.02 |