Climate Change Chart of Oaxaca, Mexico
Comprehensive Climate Change Chart of Oaxaca, Mexico: Monthly Averages and Impact Trends
Explore the changing climate of Oaxaca, Mexico with insightful data analysis. Discover the impact of temperature and rainfall variations from 1940 to 1950 compared to 2013 to 2024.
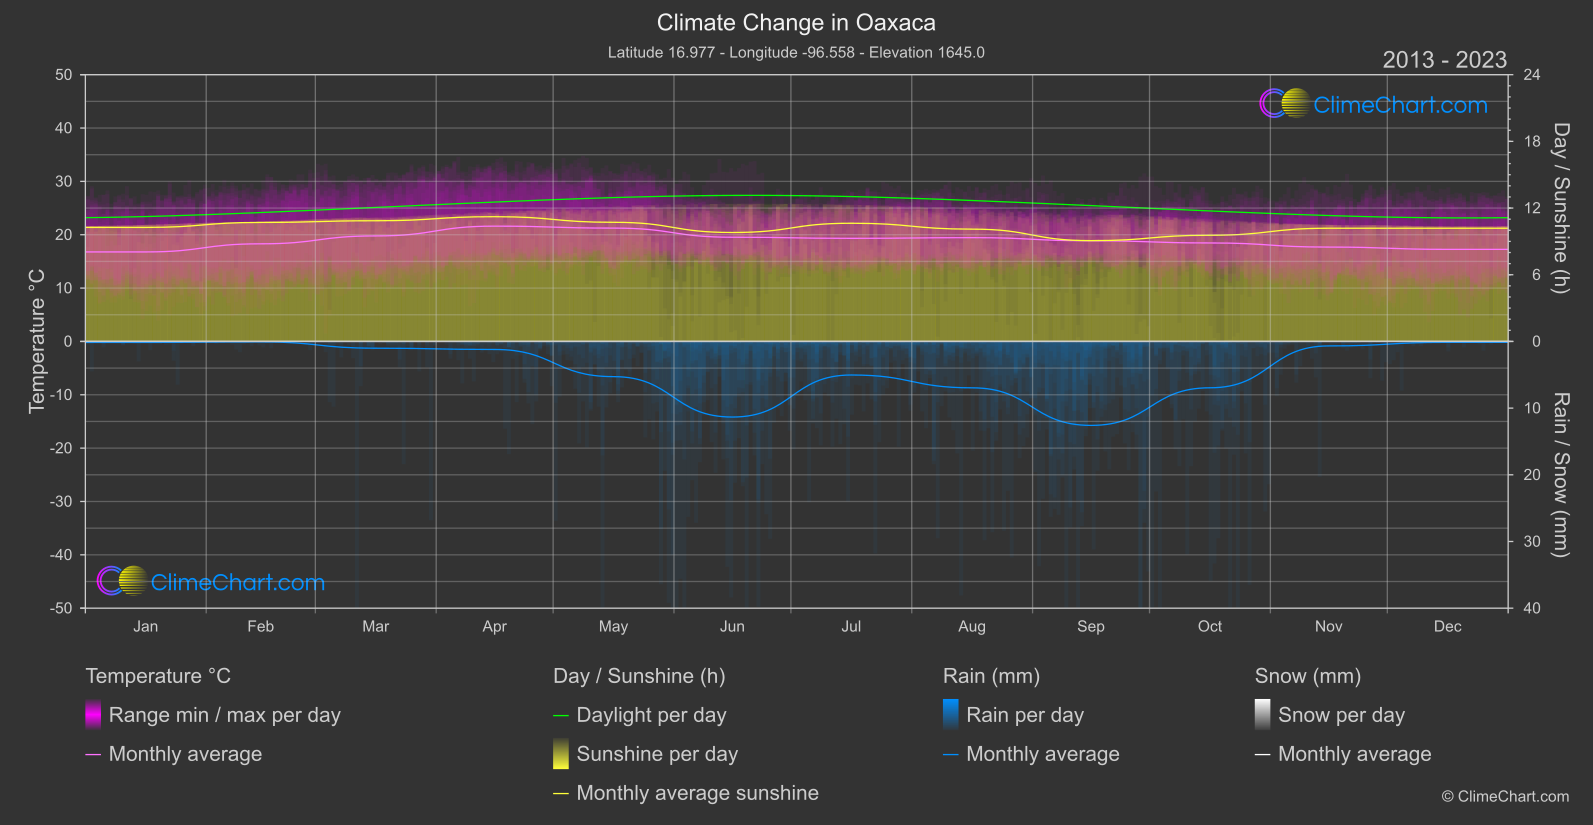
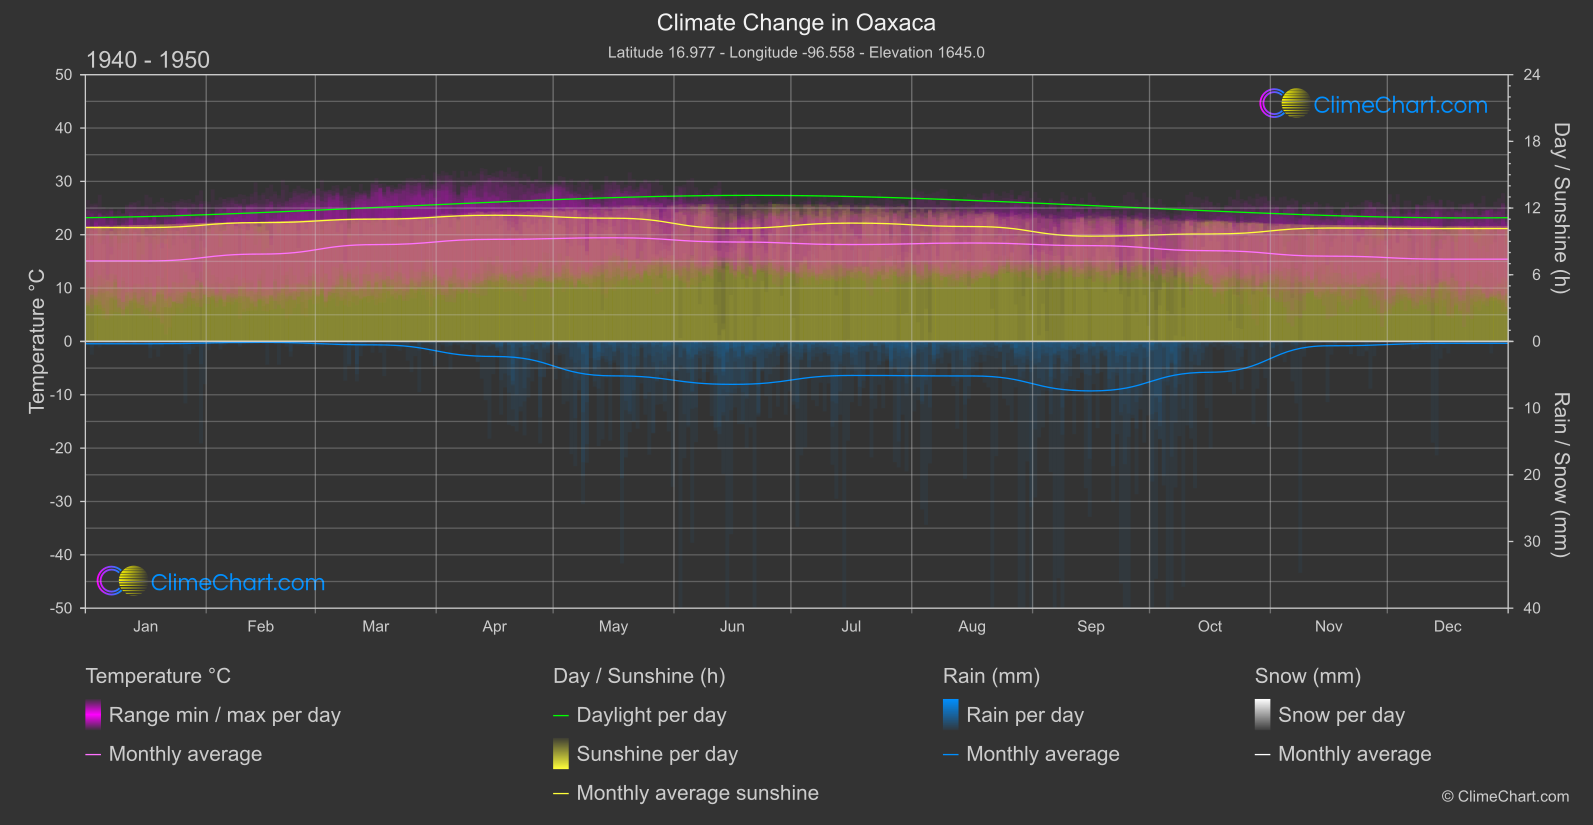
Oaxaca, Mexico, experiences significant climate changes with varying temperatures and rainfall patterns. The data from 1940 to 1950 compared to 2013 to 2024 reveals interesting insights. For example, the month with the highest temperature change is April, showing an increase of 2.47°C. In terms of rainfall, the month with the most significant change is June, with a rise of 2.45mm. The sunshine duration also fluctuates, with notable decreases in September and June. These trends highlight the evolving climate dynamics in Oaxaca.
Climate Change Data Overview for Oaxaca, Mexico
Explore the comprehensive climate change data for Oaxaca, Mexico. This detailed table provides valuable insights into temperature variations, precipitation levels, and seasonal changes influenced by climate change, helping you understand the unique weather patterns of this region.
Temperature °C
| Month | ⌀ 1940 - 1950 | ⌀ 2013 - 2023 | +/- |
|---|---|---|---|
| Jan | 15.08 | 16.78 | 1.69 |
| Feb | 16.37 | 18.30 | 1.92 |
| Mar | 18.15 | 19.78 | 1.63 |
| Apr | 19.14 | 21.61 | 2.47 |
| May | 19.43 | 21.24 | 1.81 |
| Jun | 18.64 | 19.53 | 0.89 |
| Jul | 18.16 | 19.32 | 1.16 |
| Aug | 18.45 | 19.45 | 1.01 |
| Sep | 17.96 | 18.87 | 0.91 |
| Oct | 17.01 | 18.46 | 1.45 |
| Nov | 15.98 | 17.69 | 1.70 |
| Dec | 15.42 | 17.26 | 1.84 |
| ⌀ Month | 17.48 | 19.02 | 1.54 |
Sunshine (h)
| Month | ⌀ 1940 - 1950 | ⌀ 2013 - 2023 | +/- |
|---|---|---|---|
| Jan | 10.25 | 10.26 | 0.01 |
| Feb | 10.69 | 10.71 | 0.02 |
| Mar | 11.01 | 10.86 | -0.15 |
| Apr | 11.35 | 11.22 | -0.13 |
| May | 11.09 | 10.72 | -0.37 |
| Jun | 10.18 | 9.80 | -0.38 |
| Jul | 10.65 | 10.63 | -0.01 |
| Aug | 10.34 | 10.10 | -0.23 |
| Sep | 9.48 | 9.07 | -0.41 |
| Oct | 9.67 | 9.55 | -0.11 |
| Nov | 10.20 | 10.18 | -0.02 |
| Dec | 10.15 | 10.19 | 0.03 |
| ⌀ Month | 10.42 | 10.27 | -0.15 |
Rain (mm)
| Month | ⌀ 1940 - 1950 | ⌀ 2013 - 2023 | +/- |
|---|---|---|---|
| Jan | 0.17 | 0.07 | -0.10 |
| Feb | 0.07 | 0.03 | -0.04 |
| Mar | 0.26 | 0.51 | 0.25 |
| Apr | 1.13 | 0.60 | -0.53 |
| May | 2.58 | 2.64 | 0.06 |
| Jun | 3.22 | 5.67 | 2.45 |
| Jul | 2.55 | 2.52 | -0.04 |
| Aug | 2.59 | 3.48 | 0.89 |
| Sep | 3.71 | 6.30 | 2.58 |
| Oct | 2.31 | 3.48 | 1.17 |
| Nov | 0.33 | 0.34 | 0.01 |
| Dec | 0.14 | 0.07 | -0.07 |
| ⌀ Month | 1.59 | 2.14 | 0.55 |
Snow (mm)
| Month | ⌀ 1940 - 1950 | ⌀ 2013 - 2023 | +/- |
|---|---|---|---|
| Jan | 0.00 | 0.00 | 0.00 |
| Feb | 0.00 | 0.00 | 0.00 |
| Mar | 0.00 | 0.00 | 0.00 |
| Apr | 0.00 | 0.00 | 0.00 |
| May | 0.00 | 0.00 | 0.00 |
| Jun | 0.00 | 0.00 | 0.00 |
| Jul | 0.00 | 0.00 | 0.00 |
| Aug | 0.00 | 0.00 | 0.00 |
| Sep | 0.00 | 0.00 | 0.00 |
| Oct | 0.00 | 0.00 | 0.00 |
| Nov | 0.00 | 0.00 | 0.00 |
| Dec | 0.00 | 0.00 | 0.00 |
| ⌀ Month | 0.00 | 0.00 | 0.00 |