Climate Change Chart of Oahu (Hawaii), USA
Comprehensive Climate Change Chart of Oahu (Hawaii), USA: Monthly Averages and Impact Trends
Exploring the climate changes in Oahu, Hawaii brings to light the significant shifts in temperature, rainfall, and sunshine duration over the years. Dive into the data to discover the impacts of climate change on this beautiful island.
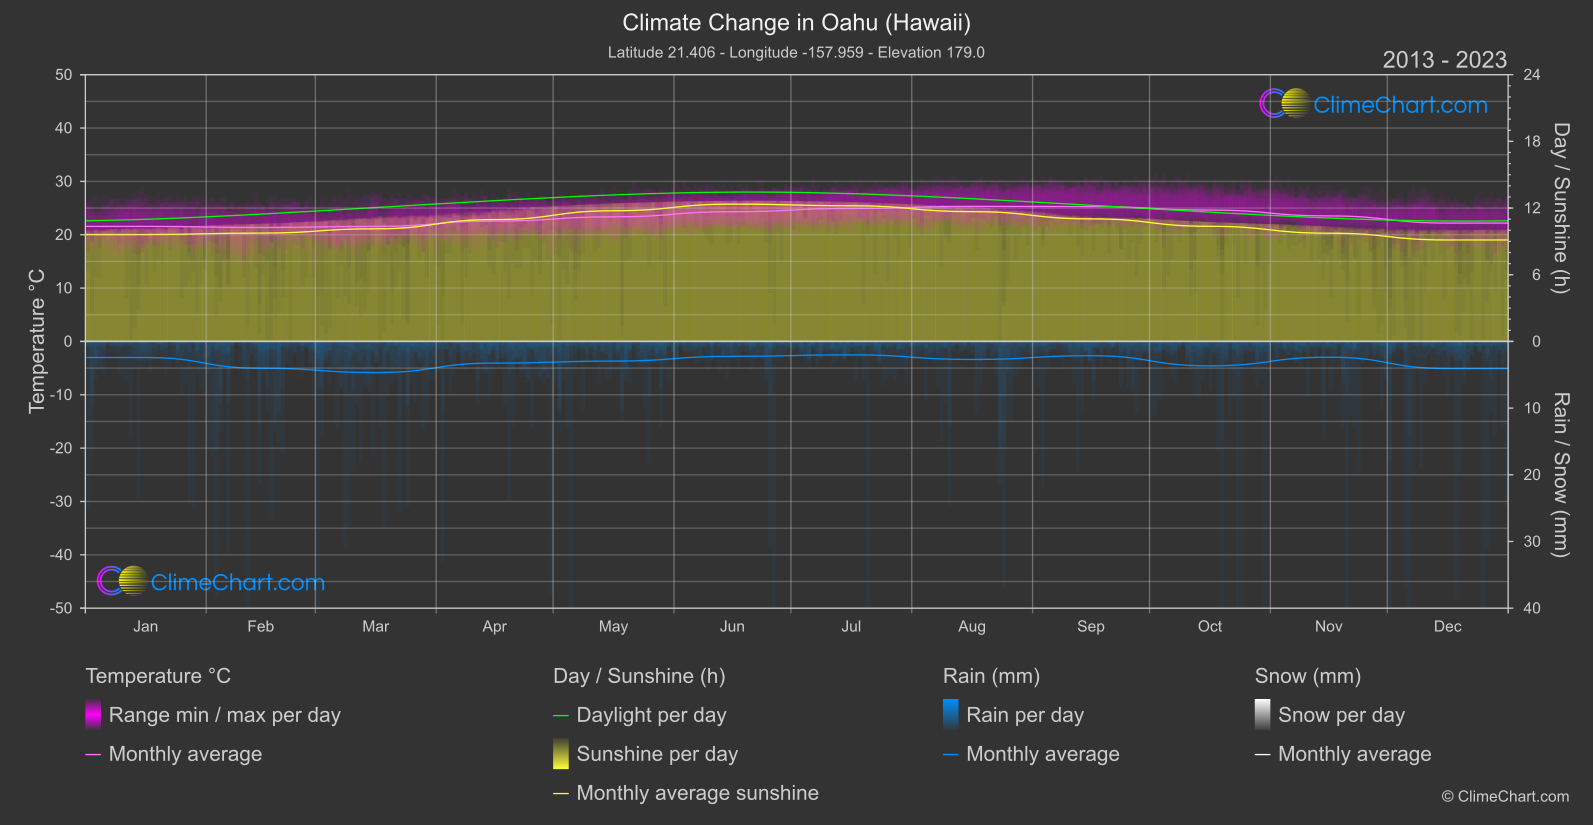
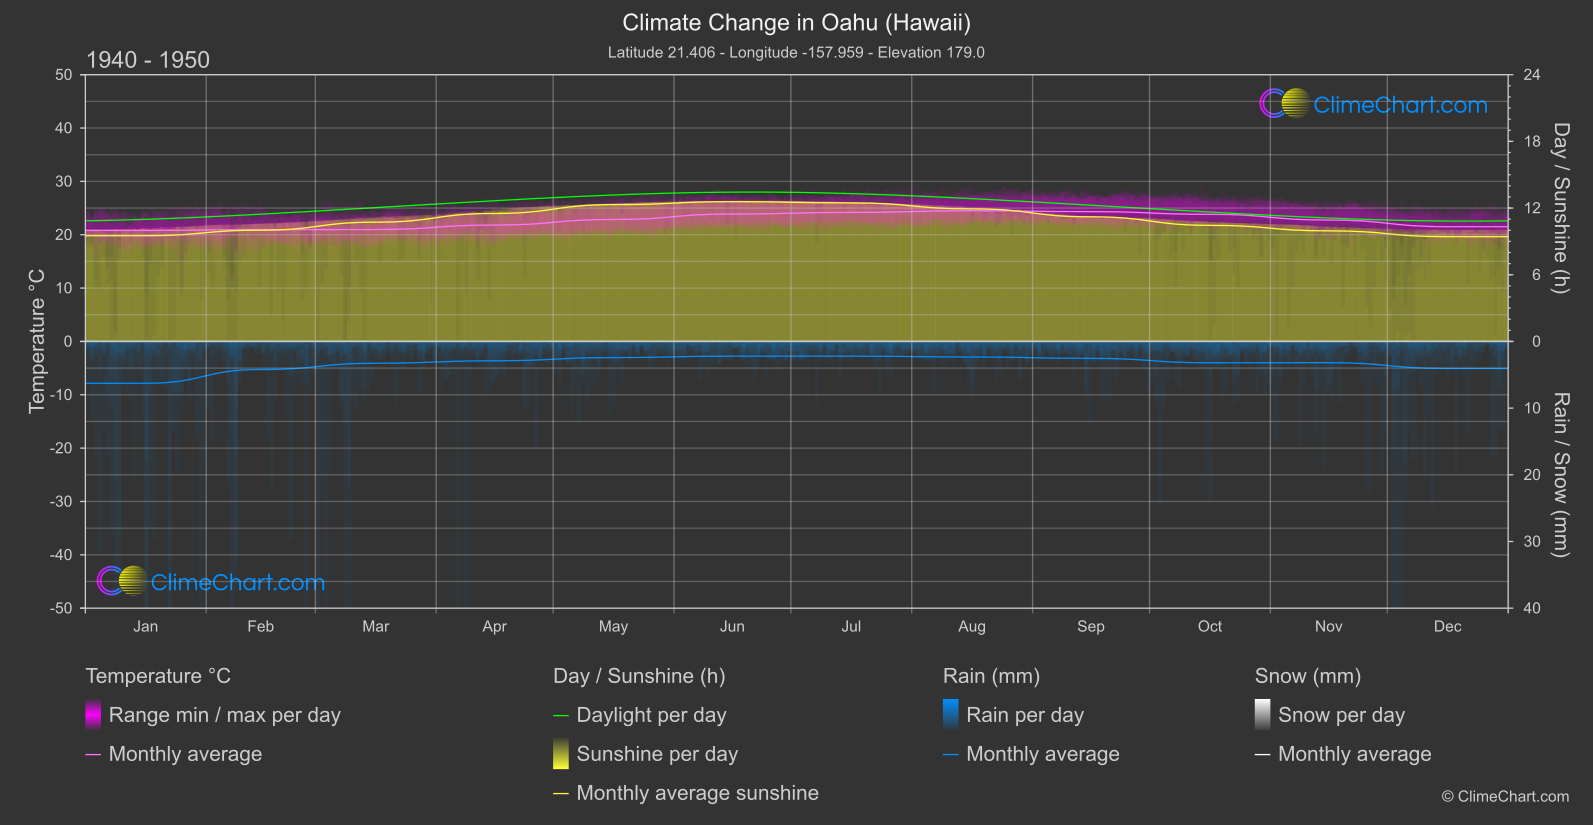
Oahu, Hawaii, known for its stunning landscapes and vibrant culture, has been experiencing notable climate shifts over the years. Analyzing the data reveals interesting patterns, such as the increase in temperatures from 1940 to 1950 compared to 2013 to 2024. Notably, the month of September shows the highest temperature change of 0.96°C, indicating a significant warming trend. In terms of rainfall, there have been fluctuations, with some months experiencing a decrease in rainfall and others showing an increase. The data on sunshine duration also highlights variations, with some months having less sunshine in recent years. These insights shed light on the changing climate dynamics in Oahu, emphasizing the importance of understanding and addressing climate change impacts.
Climate Change Data Overview for Oahu (Hawaii), USA
Explore the comprehensive climate change data for Oahu (Hawaii), USA. This detailed table provides valuable insights into temperature variations, precipitation levels, and seasonal changes influenced by climate change, helping you understand the unique weather patterns of this region.
Temperature °C
| Month | ⌀ 1940 - 1950 | ⌀ 2013 - 2023 | +/- |
|---|---|---|---|
| Jan | 20.81 | 21.56 | 0.76 |
| Feb | 20.94 | 21.36 | 0.42 |
| Mar | 20.98 | 21.56 | 0.59 |
| Apr | 21.81 | 22.56 | 0.74 |
| May | 22.86 | 23.36 | 0.49 |
| Jun | 23.88 | 24.32 | 0.44 |
| Jul | 24.19 | 24.92 | 0.74 |
| Aug | 24.50 | 25.31 | 0.82 |
| Sep | 24.33 | 25.29 | 0.96 |
| Oct | 23.83 | 24.63 | 0.80 |
| Nov | 22.75 | 23.52 | 0.77 |
| Dec | 21.51 | 22.19 | 0.68 |
| ⌀ Month | 22.70 | 23.38 | 0.68 |
Sunshine (h)
| Month | ⌀ 1940 - 1950 | ⌀ 2013 - 2023 | +/- |
|---|---|---|---|
| Jan | 9.51 | 9.62 | 0.10 |
| Feb | 10.01 | 9.75 | -0.26 |
| Mar | 10.73 | 10.13 | -0.60 |
| Apr | 11.52 | 10.96 | -0.55 |
| May | 12.31 | 11.76 | -0.55 |
| Jun | 12.58 | 12.35 | -0.22 |
| Jul | 12.46 | 12.21 | -0.26 |
| Aug | 11.93 | 11.68 | -0.25 |
| Sep | 11.21 | 11.03 | -0.18 |
| Oct | 10.45 | 10.36 | -0.09 |
| Nov | 9.95 | 9.74 | -0.21 |
| Dec | 9.42 | 9.13 | -0.30 |
| ⌀ Month | 11.01 | 10.73 | -0.28 |
Rain (mm)
| Month | ⌀ 1940 - 1950 | ⌀ 2013 - 2023 | +/- |
|---|---|---|---|
| Jan | 3.14 | 1.21 | -1.93 |
| Feb | 2.11 | 2.01 | -0.10 |
| Mar | 1.64 | 2.33 | 0.70 |
| Apr | 1.45 | 1.62 | 0.17 |
| May | 1.21 | 1.48 | 0.27 |
| Jun | 1.10 | 1.12 | 0.01 |
| Jul | 1.10 | 1.01 | -0.10 |
| Aug | 1.17 | 1.35 | 0.19 |
| Sep | 1.27 | 1.07 | -0.20 |
| Oct | 1.60 | 1.83 | 0.23 |
| Nov | 1.59 | 1.18 | -0.41 |
| Dec | 2.03 | 2.03 | 0.01 |
| ⌀ Month | 1.62 | 1.52 | -0.10 |
Snow (mm)
| Month | ⌀ 1940 - 1950 | ⌀ 2013 - 2023 | +/- |
|---|---|---|---|
| Jan | 0.00 | 0.00 | 0.00 |
| Feb | 0.00 | 0.00 | 0.00 |
| Mar | 0.00 | 0.00 | 0.00 |
| Apr | 0.00 | 0.00 | 0.00 |
| May | 0.00 | 0.00 | 0.00 |
| Jun | 0.00 | 0.00 | 0.00 |
| Jul | 0.00 | 0.00 | 0.00 |
| Aug | 0.00 | 0.00 | 0.00 |
| Sep | 0.00 | 0.00 | 0.00 |
| Oct | 0.00 | 0.00 | 0.00 |
| Nov | 0.00 | 0.00 | 0.00 |
| Dec | 0.00 | 0.00 | 0.00 |
| ⌀ Month | 0.00 | 0.00 | 0.00 |