Climate Change Chart of Nuuk, Greenland
Comprehensive Climate Change Chart of Nuuk, Greenland: Monthly Averages and Impact Trends
Exploring the changing climate in Nuuk, Greenland reveals intriguing insights into temperature, rainfall, snowfall, and sunshine duration over the years.
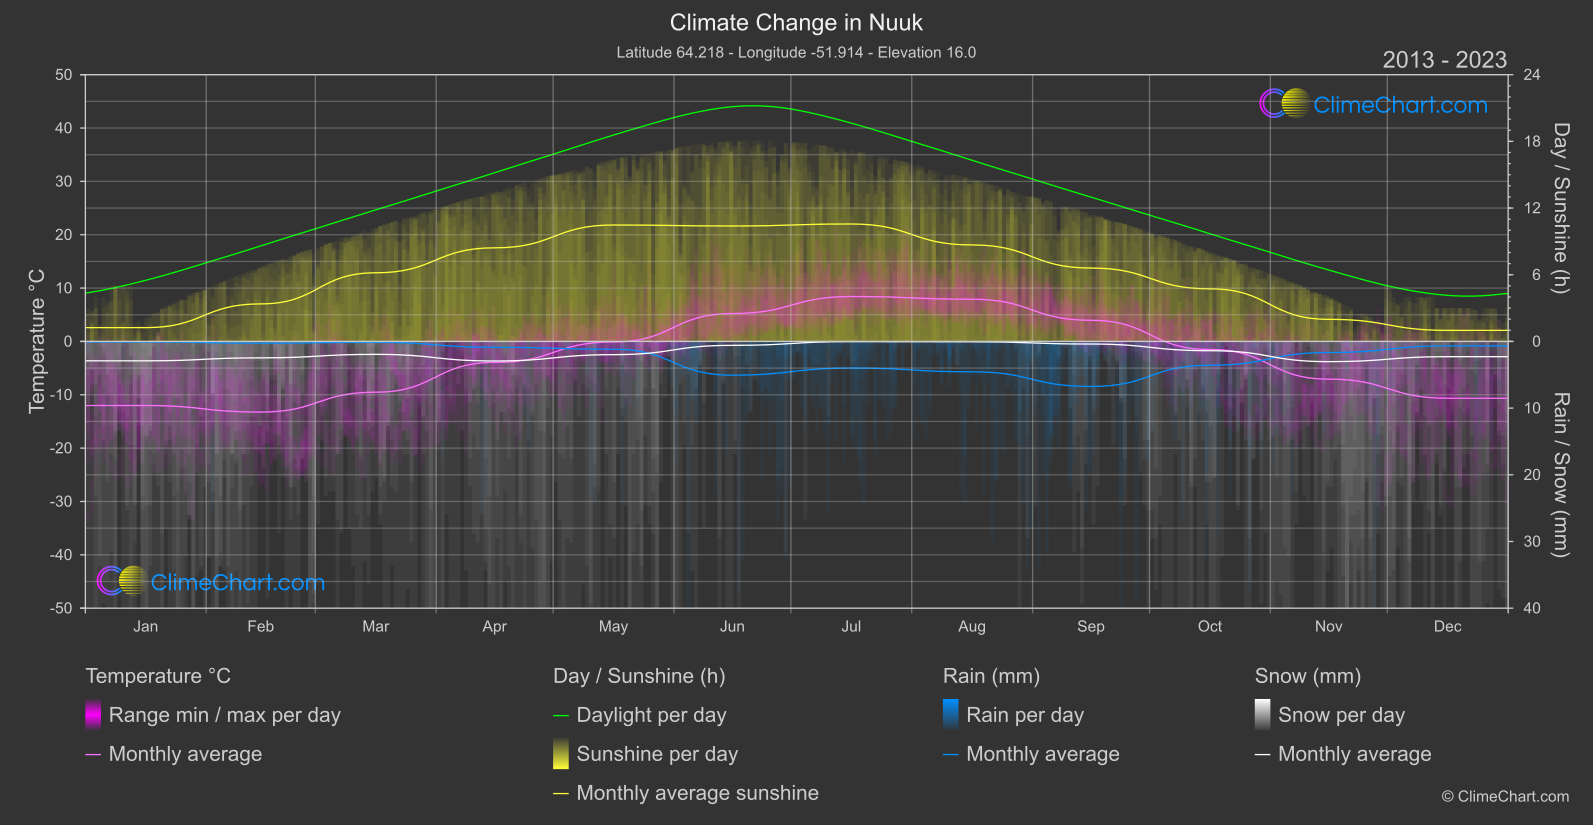
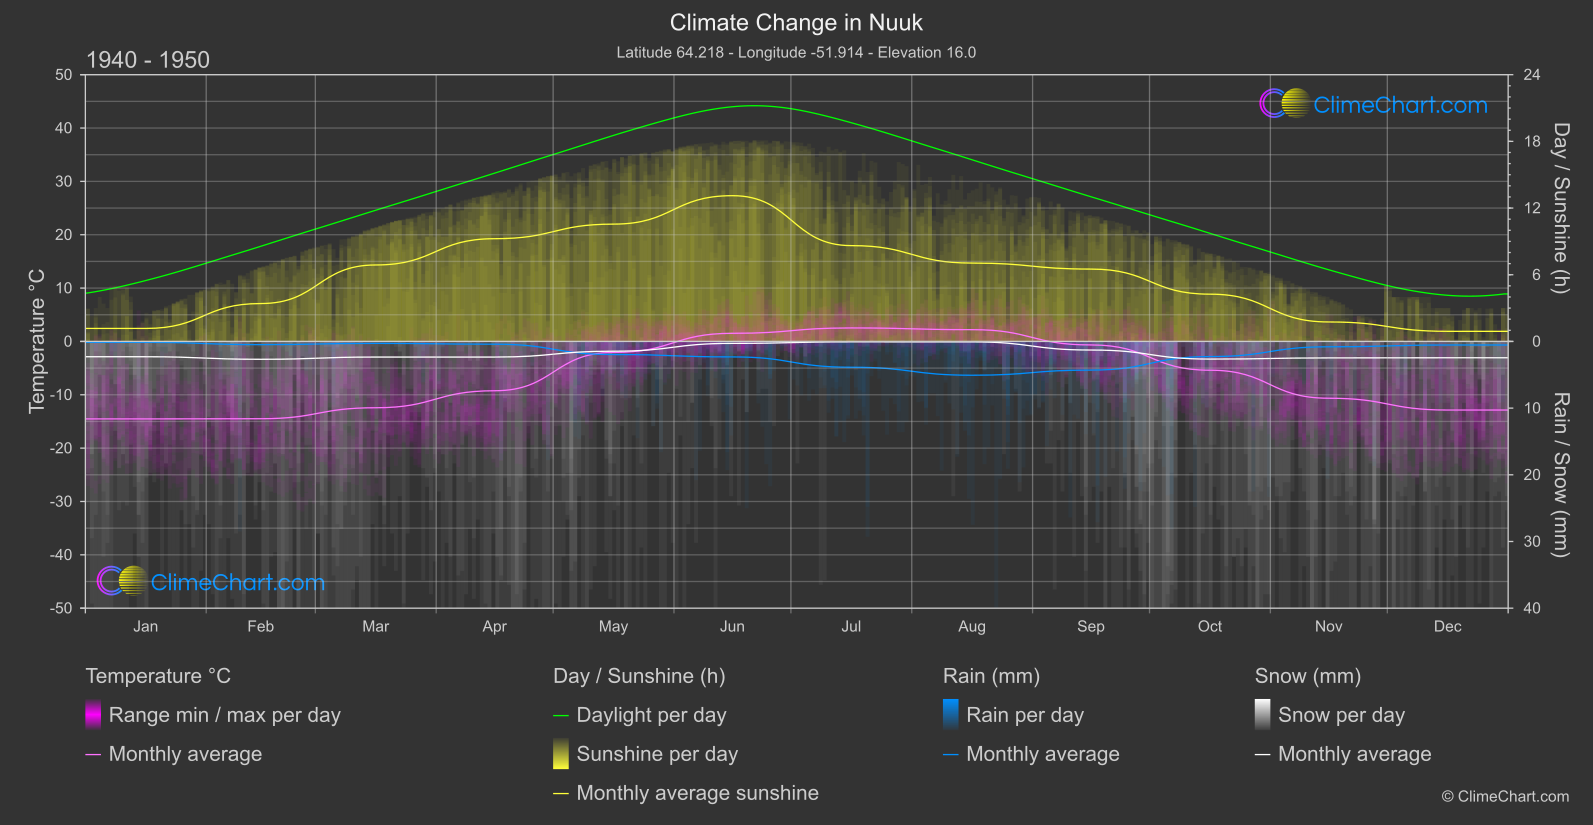
The data comparison between 1940-1950 and 2013-2024 in Nuuk, Greenland, indicates significant changes in climate. Notably, the month with the highest temperature change is April, with a 5.30°C increase. In terms of rainfall, June experienced the most considerable change with a 1.37mm rise. Additionally, the sunshine duration significantly decreased in June by 2.73 hours. These insights highlight the evolving climate patterns in Nuuk, Greenland.
Climate Change Data Overview for Nuuk, Greenland
Explore the comprehensive climate change data for Nuuk, Greenland. This detailed table provides valuable insights into temperature variations, precipitation levels, and seasonal changes influenced by climate change, helping you understand the unique weather patterns of this region.
Temperature °C
| Month | ⌀ 1940 - 1950 | ⌀ 2013 - 2023 | +/- |
|---|---|---|---|
| Jan | -14.52 | -12.01 | 2.51 |
| Feb | -14.49 | -13.24 | 1.25 |
| Mar | -12.43 | -9.51 | 2.92 |
| Apr | -9.24 | -3.94 | 5.30 |
| May | -2.06 | -0.09 | 1.97 |
| Jun | 1.52 | 5.23 | 3.71 |
| Jul | 2.53 | 8.42 | 5.89 |
| Aug | 2.21 | 7.91 | 5.70 |
| Sep | -0.66 | 3.96 | 4.62 |
| Oct | -5.40 | -1.51 | 3.89 |
| Nov | -10.65 | -7.07 | 3.58 |
| Dec | -12.86 | -10.65 | 2.21 |
| ⌀ Month | -6.34 | -2.71 | 3.63 |
Sunshine (h)
| Month | ⌀ 1940 - 1950 | ⌀ 2013 - 2023 | +/- |
|---|---|---|---|
| Jan | 1.17 | 1.24 | 0.07 |
| Feb | 3.41 | 3.38 | -0.03 |
| Mar | 6.88 | 6.18 | -0.70 |
| Apr | 9.24 | 8.42 | -0.82 |
| May | 10.56 | 10.48 | -0.08 |
| Jun | 13.11 | 10.39 | -2.73 |
| Jul | 8.62 | 10.57 | 1.95 |
| Aug | 7.05 | 8.68 | 1.63 |
| Sep | 6.51 | 6.60 | 0.09 |
| Oct | 4.25 | 4.73 | 0.48 |
| Nov | 1.75 | 1.99 | 0.24 |
| Dec | 0.91 | 1.00 | 0.09 |
| ⌀ Month | 6.12 | 6.14 | 0.02 |
Rain (mm)
| Month | ⌀ 1940 - 1950 | ⌀ 2013 - 2023 | +/- |
|---|---|---|---|
| Jan | 0.07 | 0.04 | -0.03 |
| Feb | 0.24 | 0.13 | -0.11 |
| Mar | 0.14 | 0.07 | -0.08 |
| Apr | 0.21 | 0.44 | 0.23 |
| May | 0.98 | 0.58 | -0.40 |
| Jun | 1.16 | 2.53 | 1.37 |
| Jul | 1.93 | 2.00 | 0.06 |
| Aug | 2.53 | 2.28 | -0.26 |
| Sep | 2.15 | 3.38 | 1.23 |
| Oct | 1.14 | 1.79 | 0.65 |
| Nov | 0.40 | 0.83 | 0.43 |
| Dec | 0.27 | 0.33 | 0.06 |
| ⌀ Month | 0.94 | 1.20 | 0.26 |
Snow (mm)
| Month | ⌀ 1940 - 1950 | ⌀ 2013 - 2023 | +/- |
|---|---|---|---|
| Jan | 1.15 | 1.46 | 0.31 |
| Feb | 1.34 | 1.23 | -0.11 |
| Mar | 1.17 | 0.97 | -0.20 |
| Apr | 1.17 | 1.47 | 0.30 |
| May | 0.73 | 0.99 | 0.26 |
| Jun | 0.15 | 0.29 | 0.15 |
| Jul | 0.03 | 0.01 | -0.02 |
| Aug | 0.03 | 0.03 | -0.01 |
| Sep | 0.65 | 0.19 | -0.45 |
| Oct | 1.32 | 0.70 | -0.63 |
| Nov | 1.24 | 1.52 | 0.28 |
| Dec | 1.23 | 1.14 | -0.08 |
| ⌀ Month | 0.85 | 0.83 | -0.02 |