Climate Change Chart of Nuremberg, Germany
Comprehensive Climate Change Chart of Nuremberg, Germany: Monthly Averages and Impact Trends
Explore the climate and weather changes in Nuremberg, Germany with insightful data analysis.
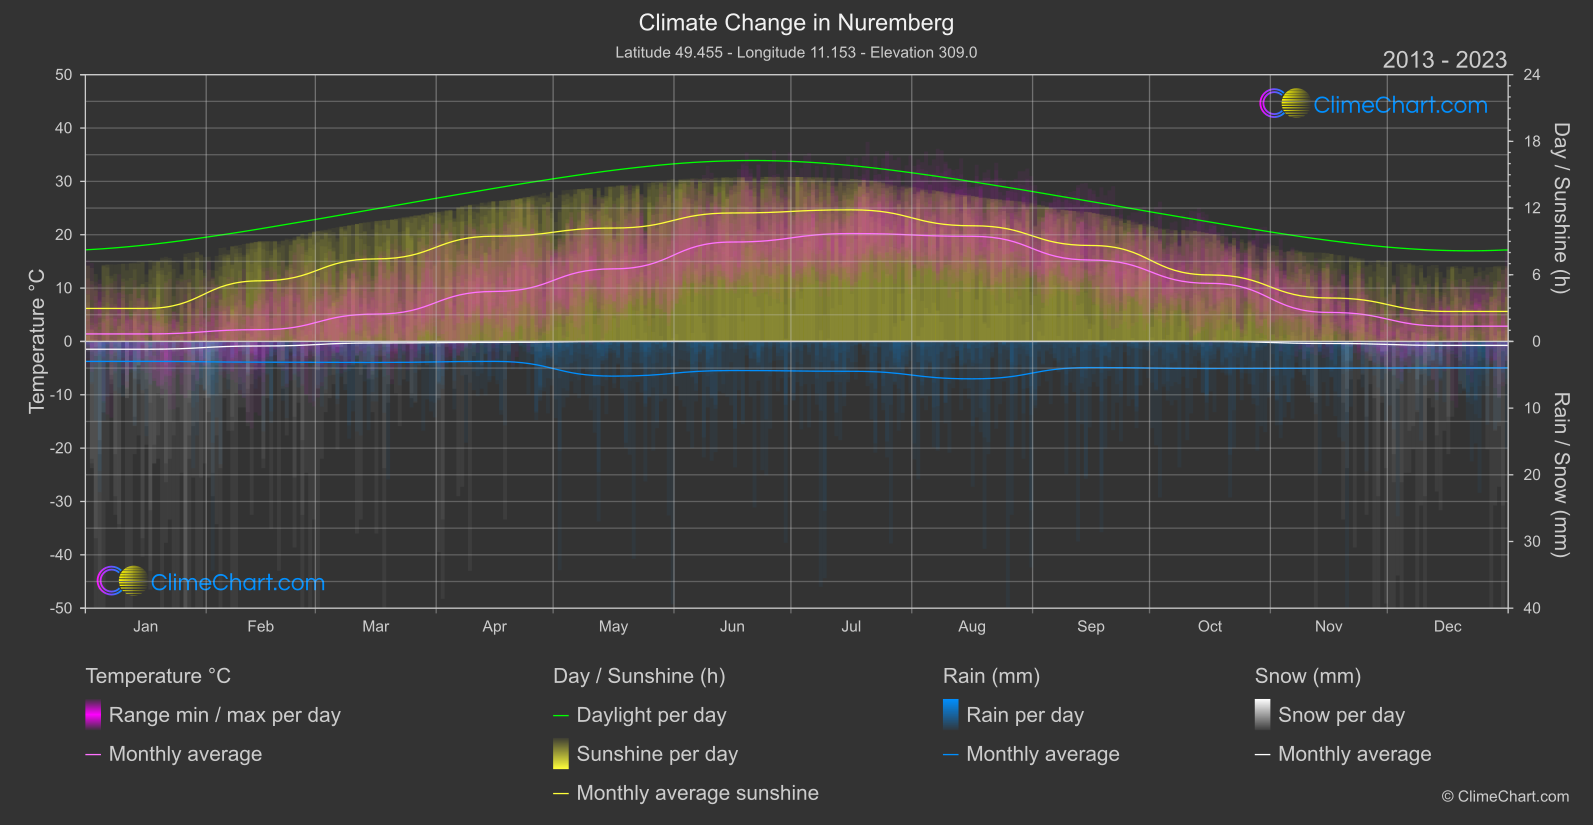
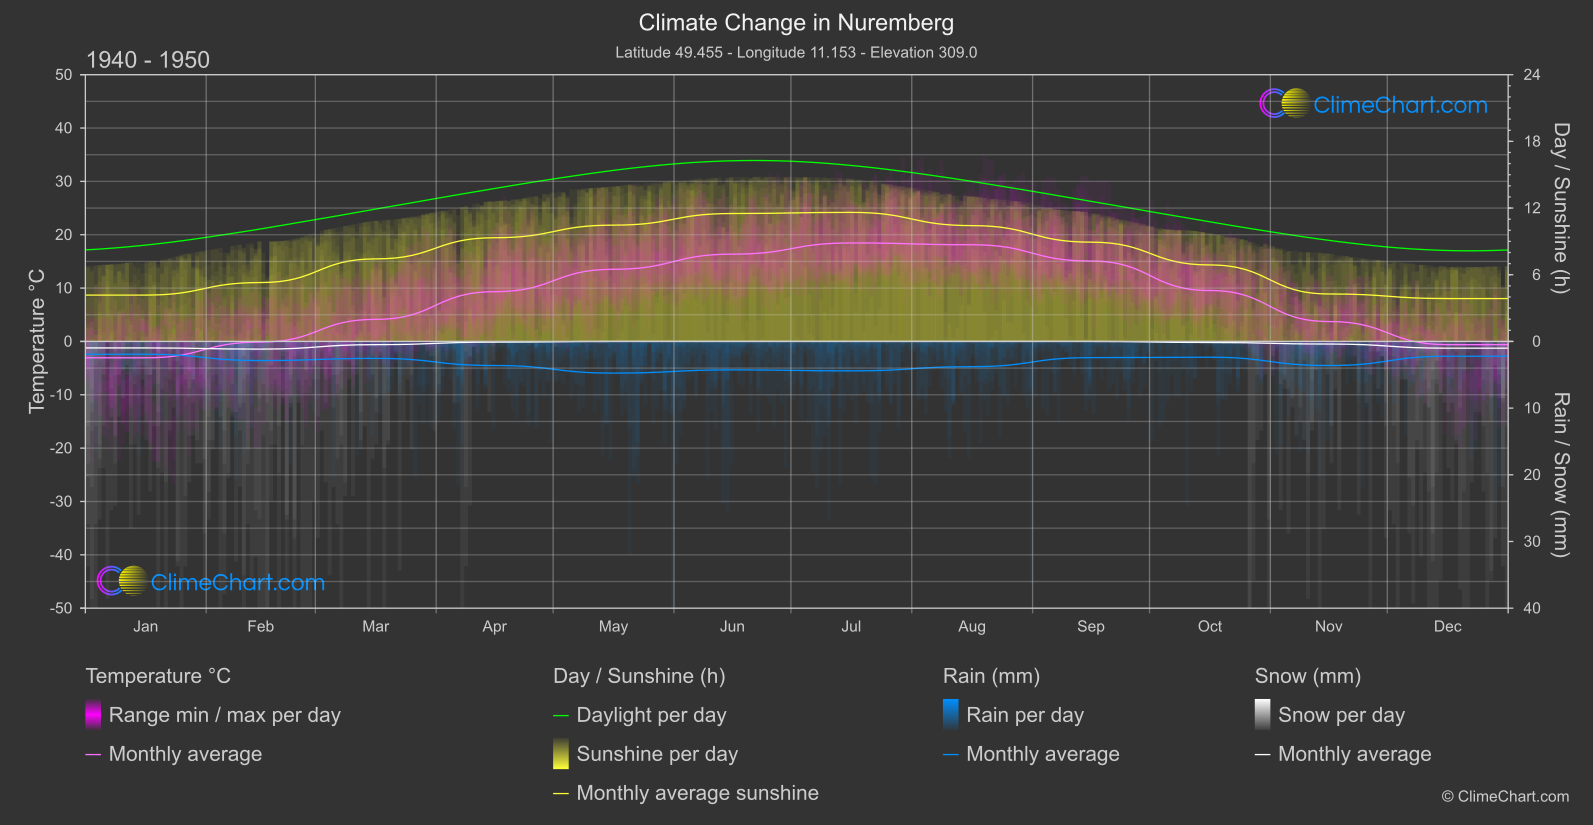
Nuremberg, Germany has experienced significant changes in temperature, rainfall, snowfall, and sunshine duration over the years. The data shows that June has seen the highest increase in temperature, while August has experienced the largest rise in rainfall. Additionally, snowfall has decreased notably in recent years, with December showing the most significant drop. Sunshine duration has also fluctuated, with November witnessing a considerable decrease in hours of sunshine.
Climate Change Data Overview for Nuremberg, Germany
Explore the comprehensive climate change data for Nuremberg, Germany. This detailed table provides valuable insights into temperature variations, precipitation levels, and seasonal changes influenced by climate change, helping you understand the unique weather patterns of this region.
Temperature °C
| Month | ⌀ 1940 - 1950 | ⌀ 2013 - 2023 | +/- |
|---|---|---|---|
| Jan | -3.07 | 1.40 | 4.47 |
| Feb | -0.12 | 2.21 | 2.33 |
| Mar | 4.14 | 5.12 | 0.98 |
| Apr | 9.32 | 9.37 | 0.04 |
| May | 13.53 | 13.61 | 0.08 |
| Jun | 16.36 | 18.63 | 2.27 |
| Jul | 18.46 | 20.22 | 1.76 |
| Aug | 18.12 | 19.70 | 1.58 |
| Sep | 15.06 | 15.25 | 0.19 |
| Oct | 9.54 | 10.89 | 1.34 |
| Nov | 3.73 | 5.44 | 1.71 |
| Dec | -0.61 | 2.85 | 3.46 |
| ⌀ Month | 8.71 | 10.39 | 1.68 |
Sunshine (h)
| Month | ⌀ 1940 - 1950 | ⌀ 2013 - 2023 | +/- |
|---|---|---|---|
| Jan | 4.17 | 2.97 | -1.20 |
| Feb | 5.30 | 5.46 | 0.16 |
| Mar | 7.43 | 7.42 | -0.00 |
| Apr | 9.33 | 9.47 | 0.14 |
| May | 10.46 | 10.20 | -0.26 |
| Jun | 11.51 | 11.56 | 0.05 |
| Jul | 11.61 | 11.84 | 0.23 |
| Aug | 10.42 | 10.41 | -0.01 |
| Sep | 8.93 | 8.63 | -0.30 |
| Oct | 6.88 | 5.98 | -0.90 |
| Nov | 4.27 | 3.91 | -0.36 |
| Dec | 3.86 | 2.70 | -1.16 |
| ⌀ Month | 7.85 | 7.55 | -0.30 |
Rain (mm)
| Month | ⌀ 1940 - 1950 | ⌀ 2013 - 2023 | +/- |
|---|---|---|---|
| Jan | 0.96 | 1.50 | 0.54 |
| Feb | 1.43 | 1.55 | 0.12 |
| Mar | 1.27 | 1.58 | 0.30 |
| Apr | 1.81 | 1.50 | -0.31 |
| May | 2.37 | 2.60 | 0.23 |
| Jun | 2.13 | 2.18 | 0.05 |
| Jul | 2.21 | 2.24 | 0.03 |
| Aug | 1.89 | 2.80 | 0.91 |
| Sep | 1.21 | 1.96 | 0.74 |
| Oct | 1.19 | 2.03 | 0.85 |
| Nov | 1.81 | 2.01 | 0.20 |
| Dec | 1.11 | 1.98 | 0.87 |
| ⌀ Month | 1.62 | 1.99 | 0.38 |
Snow (mm)
| Month | ⌀ 1940 - 1950 | ⌀ 2013 - 2023 | +/- |
|---|---|---|---|
| Jan | 0.49 | 0.59 | 0.10 |
| Feb | 0.58 | 0.34 | -0.23 |
| Mar | 0.24 | 0.11 | -0.13 |
| Apr | 0.05 | 0.07 | 0.02 |
| May | 0.00 | 0.00 | -0.00 |
| Jun | 0.00 | 0.00 | 0.00 |
| Jul | 0.00 | 0.00 | 0.00 |
| Aug | 0.00 | 0.00 | 0.00 |
| Sep | 0.00 | 0.00 | 0.00 |
| Oct | 0.08 | 0.00 | -0.08 |
| Nov | 0.19 | 0.15 | -0.04 |
| Dec | 0.51 | 0.30 | -0.21 |
| ⌀ Month | 0.18 | 0.13 | -0.05 |