Climate Change Chart of Novosibirsk, Russian Federation
Comprehensive Climate Change Chart of Novosibirsk, Russian Federation: Monthly Averages and Impact Trends
Exploring the climate change in Novosibirsk, Russian Federation reveals significant shifts in temperature, rainfall, snowfall, and sunshine duration over the years.
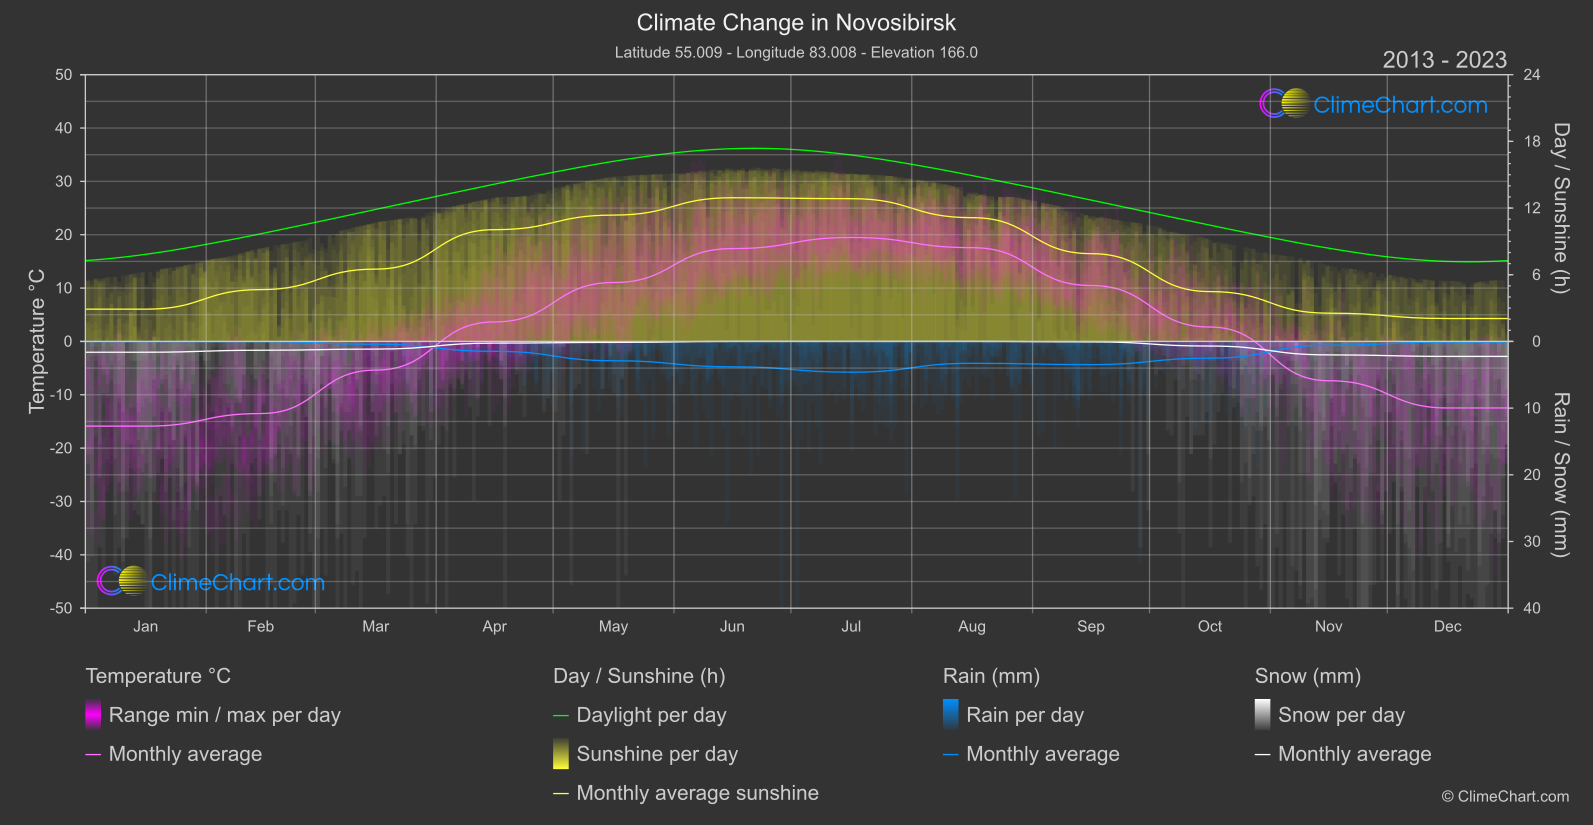
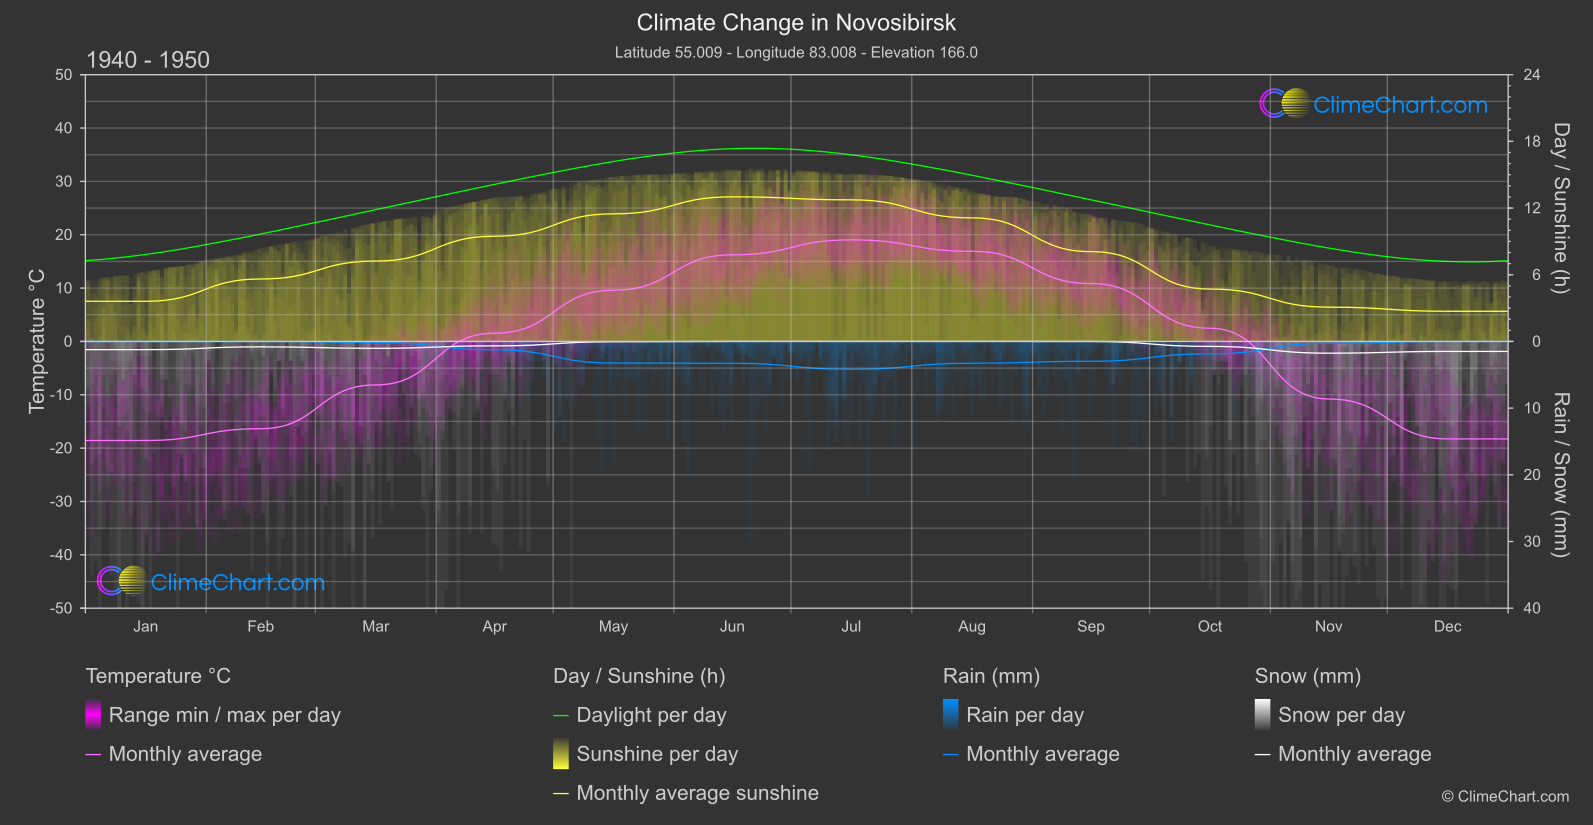
Novosibirsk, located in the Russian Federation, has experienced notable changes in climate parameters. From the data analysis, it is evident that December has shown the highest temperature change over the years, while April has witnessed significant variations in rainfall. Furthermore, the snowfall in December has notably increased since 1940. Sunshine duration has fluctuated throughout the months, with the most significant change observed in March and December.
Climate Change Data Overview for Novosibirsk, Russian Federation
Explore the comprehensive climate change data for Novosibirsk, Russian Federation. This detailed table provides valuable insights into temperature variations, precipitation levels, and seasonal changes influenced by climate change, helping you understand the unique weather patterns of this region.
Temperature °C
| Month | ⌀ 1940 - 1950 | ⌀ 2013 - 2023 | +/- |
|---|---|---|---|
| Jan | -18.57 | -15.88 | 2.69 |
| Feb | -16.36 | -13.52 | 2.84 |
| Mar | -8.15 | -5.38 | 2.78 |
| Apr | 1.54 | 3.66 | 2.12 |
| May | 9.60 | 11.04 | 1.45 |
| Jun | 16.24 | 17.40 | 1.16 |
| Jul | 19.04 | 19.49 | 0.45 |
| Aug | 16.89 | 17.58 | 0.69 |
| Sep | 10.85 | 10.48 | -0.37 |
| Oct | 2.48 | 2.70 | 0.22 |
| Nov | -10.79 | -7.37 | 3.42 |
| Dec | -18.27 | -12.47 | 5.80 |
| ⌀ Month | 0.37 | 2.31 | 1.94 |
Sunshine (h)
| Month | ⌀ 1940 - 1950 | ⌀ 2013 - 2023 | +/- |
|---|---|---|---|
| Jan | 3.61 | 2.90 | -0.71 |
| Feb | 5.62 | 4.66 | -0.96 |
| Mar | 7.23 | 6.51 | -0.72 |
| Apr | 9.47 | 10.06 | 0.59 |
| May | 11.48 | 11.37 | -0.11 |
| Jun | 13.01 | 12.93 | -0.08 |
| Jul | 12.74 | 12.84 | 0.10 |
| Aug | 11.11 | 11.13 | 0.02 |
| Sep | 8.08 | 7.90 | -0.18 |
| Oct | 4.72 | 4.49 | -0.23 |
| Nov | 3.08 | 2.54 | -0.54 |
| Dec | 2.71 | 2.06 | -0.65 |
| ⌀ Month | 7.74 | 7.45 | -0.29 |
Rain (mm)
| Month | ⌀ 1940 - 1950 | ⌀ 2013 - 2023 | +/- |
|---|---|---|---|
| Jan | 0.00 | 0.01 | 0.01 |
| Feb | 0.00 | 0.01 | 0.01 |
| Mar | 0.08 | 0.21 | 0.14 |
| Apr | 0.63 | 0.74 | 0.12 |
| May | 1.62 | 1.45 | -0.17 |
| Jun | 1.64 | 1.90 | 0.27 |
| Jul | 2.09 | 2.31 | 0.22 |
| Aug | 1.63 | 1.64 | 0.01 |
| Sep | 1.49 | 1.74 | 0.25 |
| Oct | 0.93 | 1.26 | 0.33 |
| Nov | 0.14 | 0.28 | 0.15 |
| Dec | 0.00 | 0.05 | 0.04 |
| ⌀ Month | 0.85 | 0.97 | 0.11 |
Snow (mm)
| Month | ⌀ 1940 - 1950 | ⌀ 2013 - 2023 | +/- |
|---|---|---|---|
| Jan | 0.61 | 0.81 | 0.19 |
| Feb | 0.41 | 0.66 | 0.25 |
| Mar | 0.52 | 0.57 | 0.06 |
| Apr | 0.33 | 0.12 | -0.21 |
| May | 0.02 | 0.07 | 0.05 |
| Jun | 0.00 | 0.00 | 0.00 |
| Jul | 0.00 | 0.00 | 0.00 |
| Aug | 0.00 | 0.00 | 0.00 |
| Sep | 0.00 | 0.03 | 0.03 |
| Oct | 0.37 | 0.35 | -0.03 |
| Nov | 0.88 | 1.01 | 0.13 |
| Dec | 0.75 | 1.12 | 0.37 |
| ⌀ Month | 0.32 | 0.40 | 0.07 |