Climate Change Chart of Novosibirsk (Sibiria), Russian Federation
Comprehensive Climate Change Chart of Novosibirsk (Sibiria), Russian Federation: Monthly Averages and Impact Trends
Explore the climate change data in Novosibirsk, Siberia, Russian Federation, comparing temperature, rainfall, snowfall, and sunshine duration from 1940-1950 to 2013-2024.
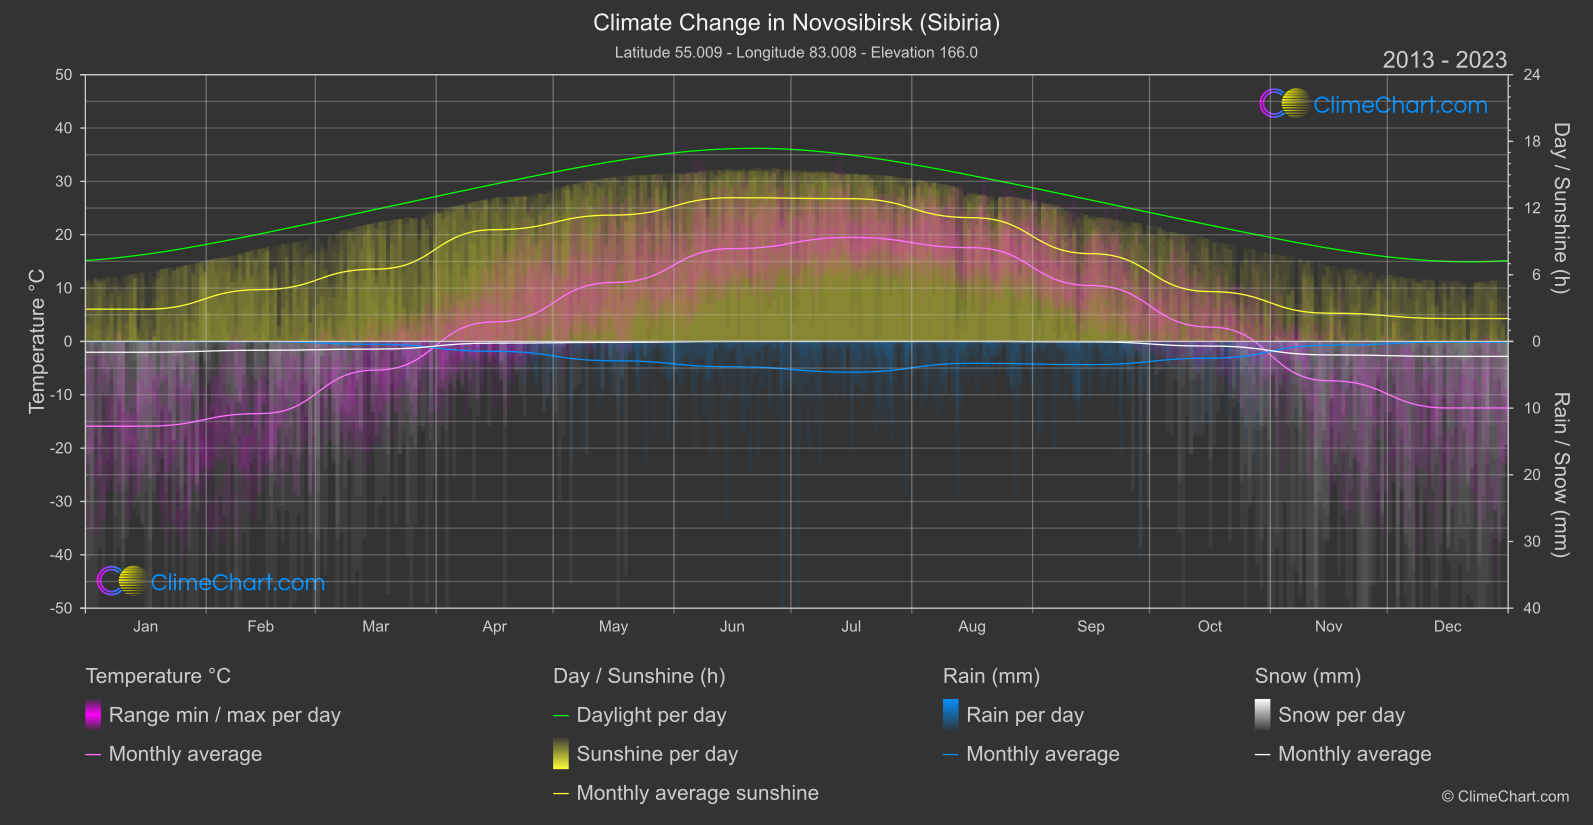
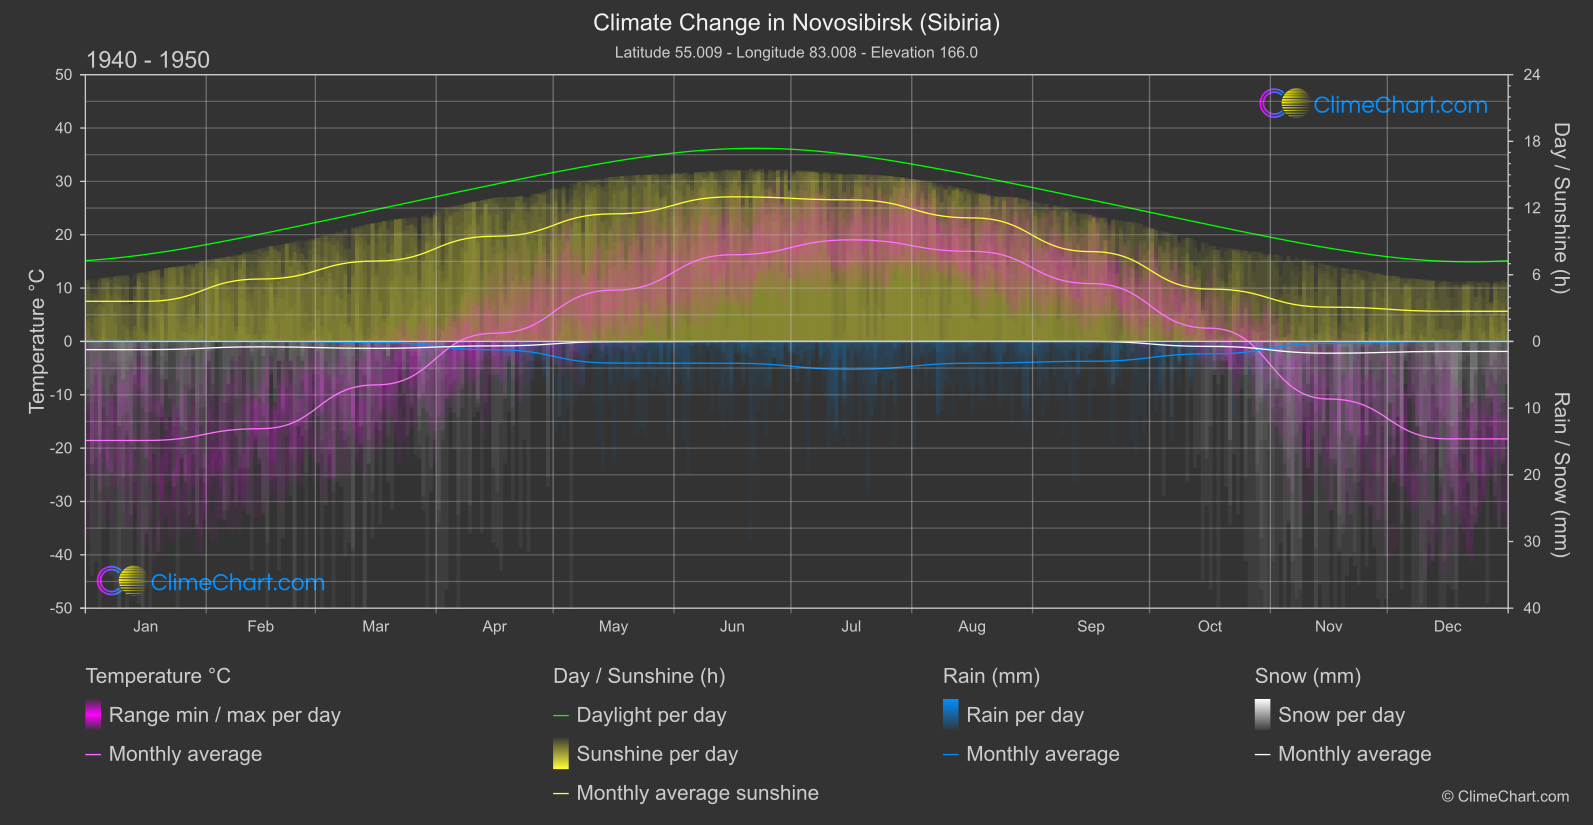
Novosibirsk, located in Siberia, Russian Federation, has experienced significant climate changes over the years. The data shows a clear trend of increasing temperatures with notable changes in rainfall and snowfall patterns. Notably, December has seen the highest temperature increase and snowfall change, reflecting the impact of climate change on this region. While temperatures have risen in most months, September stands out with a slight decrease in temperature. The sunshine duration has also shown variations across the months, with some experiencing decreases while others show an increase.
Climate Change Data Overview for Novosibirsk (Sibiria), Russian Federation
Explore the comprehensive climate change data for Novosibirsk (Sibiria), Russian Federation. This detailed table provides valuable insights into temperature variations, precipitation levels, and seasonal changes influenced by climate change, helping you understand the unique weather patterns of this region.
Temperature °C
| Month | ⌀ 1940 - 1950 | ⌀ 2013 - 2023 | +/- |
|---|---|---|---|
| Jan | -18.57 | -15.88 | 2.69 |
| Feb | -16.36 | -13.52 | 2.84 |
| Mar | -8.15 | -5.38 | 2.78 |
| Apr | 1.54 | 3.66 | 2.12 |
| May | 9.60 | 11.04 | 1.45 |
| Jun | 16.24 | 17.40 | 1.16 |
| Jul | 19.04 | 19.49 | 0.45 |
| Aug | 16.89 | 17.58 | 0.69 |
| Sep | 10.85 | 10.48 | -0.37 |
| Oct | 2.48 | 2.70 | 0.22 |
| Nov | -10.79 | -7.37 | 3.42 |
| Dec | -18.27 | -12.47 | 5.80 |
| ⌀ Month | 0.37 | 2.31 | 1.94 |
Sunshine (h)
| Month | ⌀ 1940 - 1950 | ⌀ 2013 - 2023 | +/- |
|---|---|---|---|
| Jan | 3.61 | 2.90 | -0.71 |
| Feb | 5.62 | 4.66 | -0.96 |
| Mar | 7.23 | 6.51 | -0.72 |
| Apr | 9.47 | 10.06 | 0.59 |
| May | 11.48 | 11.37 | -0.11 |
| Jun | 13.01 | 12.93 | -0.08 |
| Jul | 12.74 | 12.84 | 0.10 |
| Aug | 11.11 | 11.13 | 0.02 |
| Sep | 8.08 | 7.90 | -0.18 |
| Oct | 4.72 | 4.49 | -0.23 |
| Nov | 3.08 | 2.54 | -0.54 |
| Dec | 2.71 | 2.06 | -0.65 |
| ⌀ Month | 7.74 | 7.45 | -0.29 |
Rain (mm)
| Month | ⌀ 1940 - 1950 | ⌀ 2013 - 2023 | +/- |
|---|---|---|---|
| Jan | 0.00 | 0.01 | 0.01 |
| Feb | 0.00 | 0.01 | 0.01 |
| Mar | 0.08 | 0.21 | 0.14 |
| Apr | 0.63 | 0.74 | 0.12 |
| May | 1.62 | 1.45 | -0.17 |
| Jun | 1.64 | 1.90 | 0.27 |
| Jul | 2.09 | 2.31 | 0.22 |
| Aug | 1.63 | 1.64 | 0.01 |
| Sep | 1.49 | 1.74 | 0.25 |
| Oct | 0.93 | 1.26 | 0.33 |
| Nov | 0.14 | 0.28 | 0.15 |
| Dec | 0.00 | 0.05 | 0.04 |
| ⌀ Month | 0.85 | 0.97 | 0.11 |
Snow (mm)
| Month | ⌀ 1940 - 1950 | ⌀ 2013 - 2023 | +/- |
|---|---|---|---|
| Jan | 0.61 | 0.81 | 0.19 |
| Feb | 0.41 | 0.66 | 0.25 |
| Mar | 0.52 | 0.57 | 0.06 |
| Apr | 0.33 | 0.12 | -0.21 |
| May | 0.02 | 0.07 | 0.05 |
| Jun | 0.00 | 0.00 | 0.00 |
| Jul | 0.00 | 0.00 | 0.00 |
| Aug | 0.00 | 0.00 | 0.00 |
| Sep | 0.00 | 0.03 | 0.03 |
| Oct | 0.37 | 0.35 | -0.03 |
| Nov | 0.88 | 1.01 | 0.13 |
| Dec | 0.75 | 1.12 | 0.37 |
| ⌀ Month | 0.32 | 0.40 | 0.07 |