Climate Change Chart of North Nicosia, Cyprus
Comprehensive Climate Change Chart of North Nicosia, Cyprus: Monthly Averages and Impact Trends
Explore the changing climate in North Nicosia, Cyprus with insightful data analysis. Discover the trends in temperature, rainfall, snowfall, and sunshine duration from 1940 to 1950 compared to 2013 to 2024.
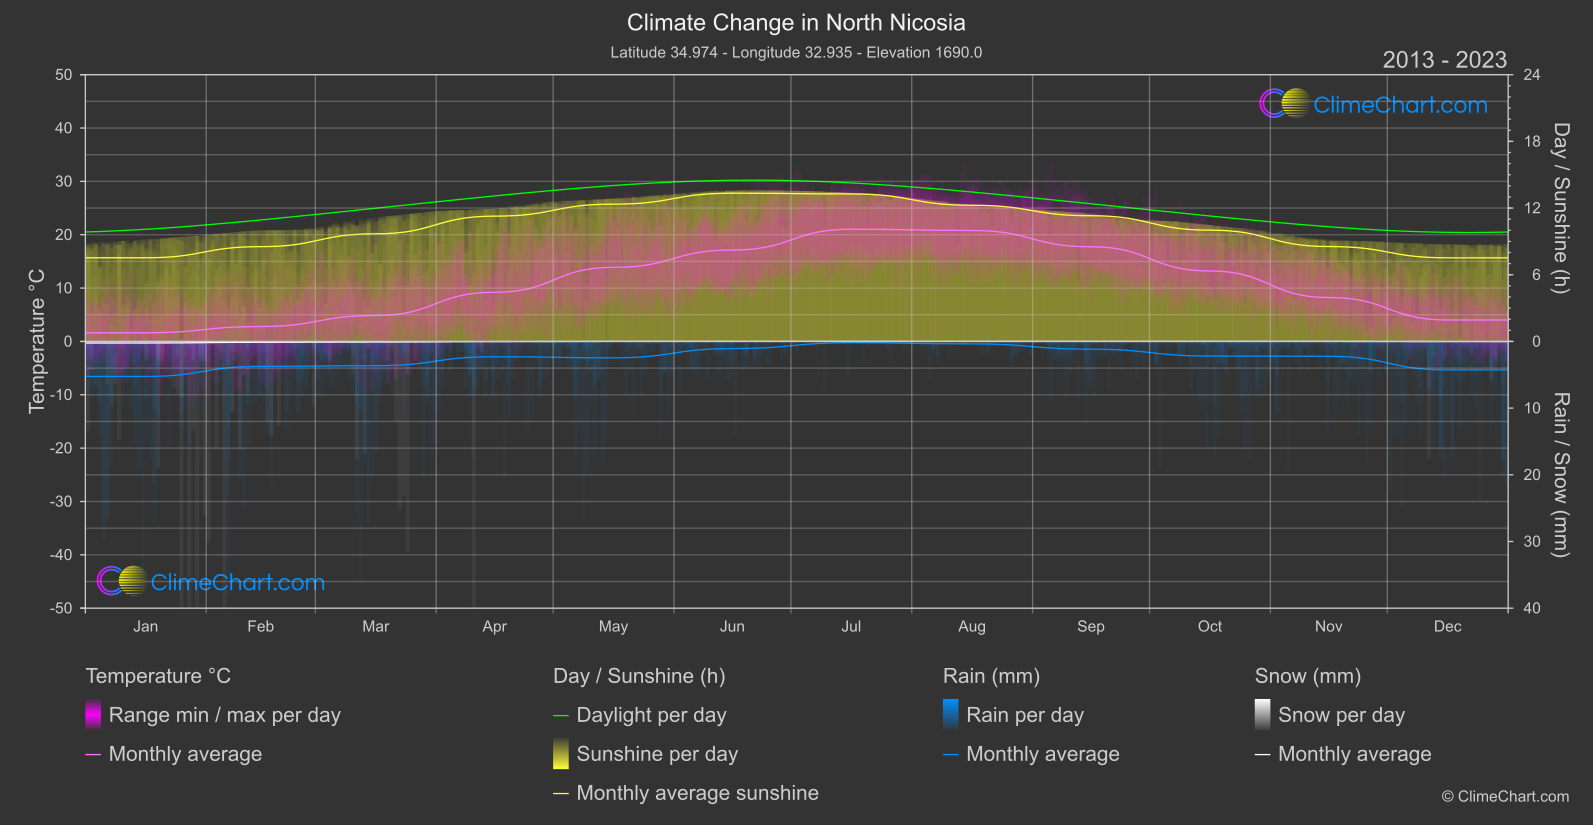
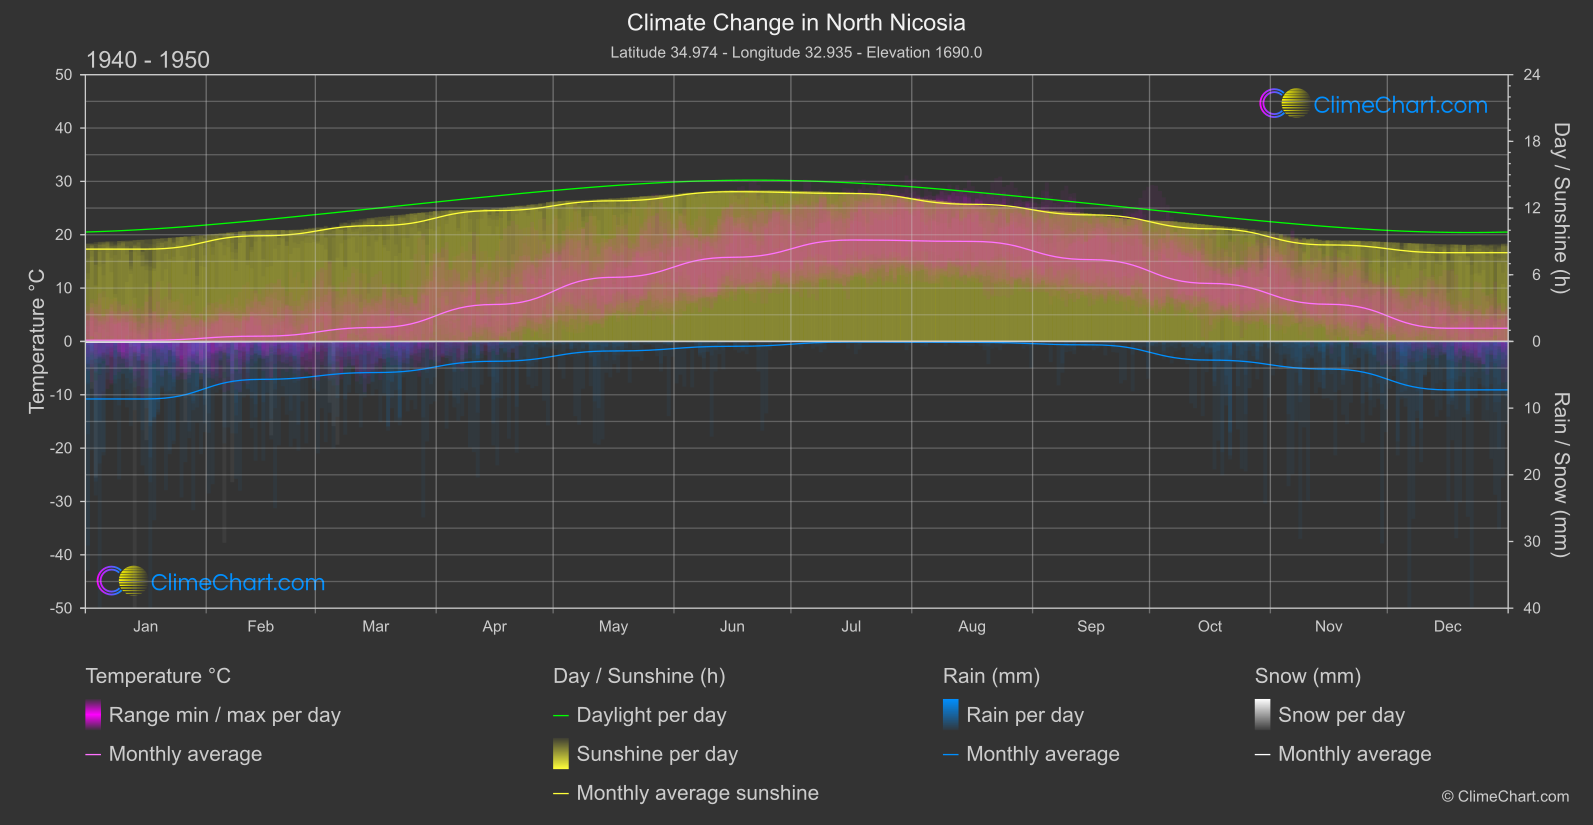
North Nicosia, Cyprus, experiences significant changes in climate patterns over the years. From January to December, the temperature has shown a consistent increase, with September having the highest temperature change of 2.41°C. In terms of rainfall, variations are observed across the months, with May showing a significant increase in rainfall of 0.52mm. Snowfall has generally decreased, with January having the highest change of 0.06mm. Sunshine duration has slightly decreased across the months, with December experiencing the most significant decrease of 0.46 hours.
Climate Change Data Overview for North Nicosia, Cyprus
Explore the comprehensive climate change data for North Nicosia, Cyprus. This detailed table provides valuable insights into temperature variations, precipitation levels, and seasonal changes influenced by climate change, helping you understand the unique weather patterns of this region.
Temperature °C
| Month | ⌀ 1940 - 1950 | ⌀ 2013 - 2023 | +/- |
|---|---|---|---|
| Jan | 0.23 | 1.62 | 1.39 |
| Feb | 0.99 | 2.79 | 1.80 |
| Mar | 2.61 | 4.86 | 2.25 |
| Apr | 6.93 | 9.22 | 2.29 |
| May | 12.02 | 13.89 | 1.87 |
| Jun | 15.77 | 17.13 | 1.36 |
| Jul | 19.01 | 21.03 | 2.02 |
| Aug | 18.75 | 20.80 | 2.05 |
| Sep | 15.33 | 17.74 | 2.41 |
| Oct | 10.87 | 13.20 | 2.33 |
| Nov | 6.96 | 8.23 | 1.27 |
| Dec | 2.47 | 4.02 | 1.54 |
| ⌀ Month | 9.33 | 11.21 | 1.88 |
Sunshine (h)
| Month | ⌀ 1940 - 1950 | ⌀ 2013 - 2023 | +/- |
|---|---|---|---|
| Jan | 8.30 | 7.53 | -0.78 |
| Feb | 9.51 | 8.53 | -0.98 |
| Mar | 10.42 | 9.68 | -0.74 |
| Apr | 11.77 | 11.27 | -0.50 |
| May | 12.65 | 12.35 | -0.30 |
| Jun | 13.47 | 13.34 | -0.13 |
| Jul | 13.32 | 13.27 | -0.05 |
| Aug | 12.34 | 12.25 | -0.09 |
| Sep | 11.39 | 11.31 | -0.08 |
| Oct | 10.13 | 10.01 | -0.12 |
| Nov | 8.68 | 8.54 | -0.14 |
| Dec | 7.98 | 7.52 | -0.46 |
| ⌀ Month | 10.83 | 10.47 | -0.36 |
Rain (mm)
| Month | ⌀ 1940 - 1950 | ⌀ 2013 - 2023 | +/- |
|---|---|---|---|
| Jan | 4.31 | 2.62 | -1.69 |
| Feb | 2.84 | 1.87 | -0.98 |
| Mar | 2.33 | 1.82 | -0.51 |
| Apr | 1.49 | 1.15 | -0.34 |
| May | 0.71 | 1.23 | 0.52 |
| Jun | 0.36 | 0.54 | 0.17 |
| Jul | 0.04 | 0.10 | 0.05 |
| Aug | 0.07 | 0.18 | 0.11 |
| Sep | 0.26 | 0.58 | 0.33 |
| Oct | 1.40 | 1.10 | -0.30 |
| Nov | 2.07 | 1.12 | -0.96 |
| Dec | 3.63 | 2.13 | -1.50 |
| ⌀ Month | 1.63 | 1.20 | -0.43 |
Snow (mm)
| Month | ⌀ 1940 - 1950 | ⌀ 2013 - 2023 | +/- |
|---|---|---|---|
| Jan | 0.05 | 0.12 | 0.06 |
| Feb | 0.02 | 0.06 | 0.04 |
| Mar | 0.01 | 0.04 | 0.03 |
| Apr | 0.00 | 0.01 | 0.01 |
| May | 0.00 | 0.00 | 0.00 |
| Jun | 0.00 | 0.00 | 0.00 |
| Jul | 0.00 | 0.00 | 0.00 |
| Aug | 0.00 | 0.00 | 0.00 |
| Sep | 0.00 | 0.00 | 0.00 |
| Oct | 0.00 | 0.00 | 0.00 |
| Nov | 0.00 | 0.00 | 0.00 |
| Dec | 0.00 | 0.01 | 0.01 |
| ⌀ Month | 0.01 | 0.02 | 0.01 |