Climate Change Chart of Nizhny Novgorod, Russian Federation
Comprehensive Climate Change Chart of Nizhny Novgorod, Russian Federation: Monthly Averages and Impact Trends
Exploring the changing climate in Nizhny Novgorod, Russian Federation reveals significant shifts in temperature, rainfall, snowfall, and sunshine duration over the years.
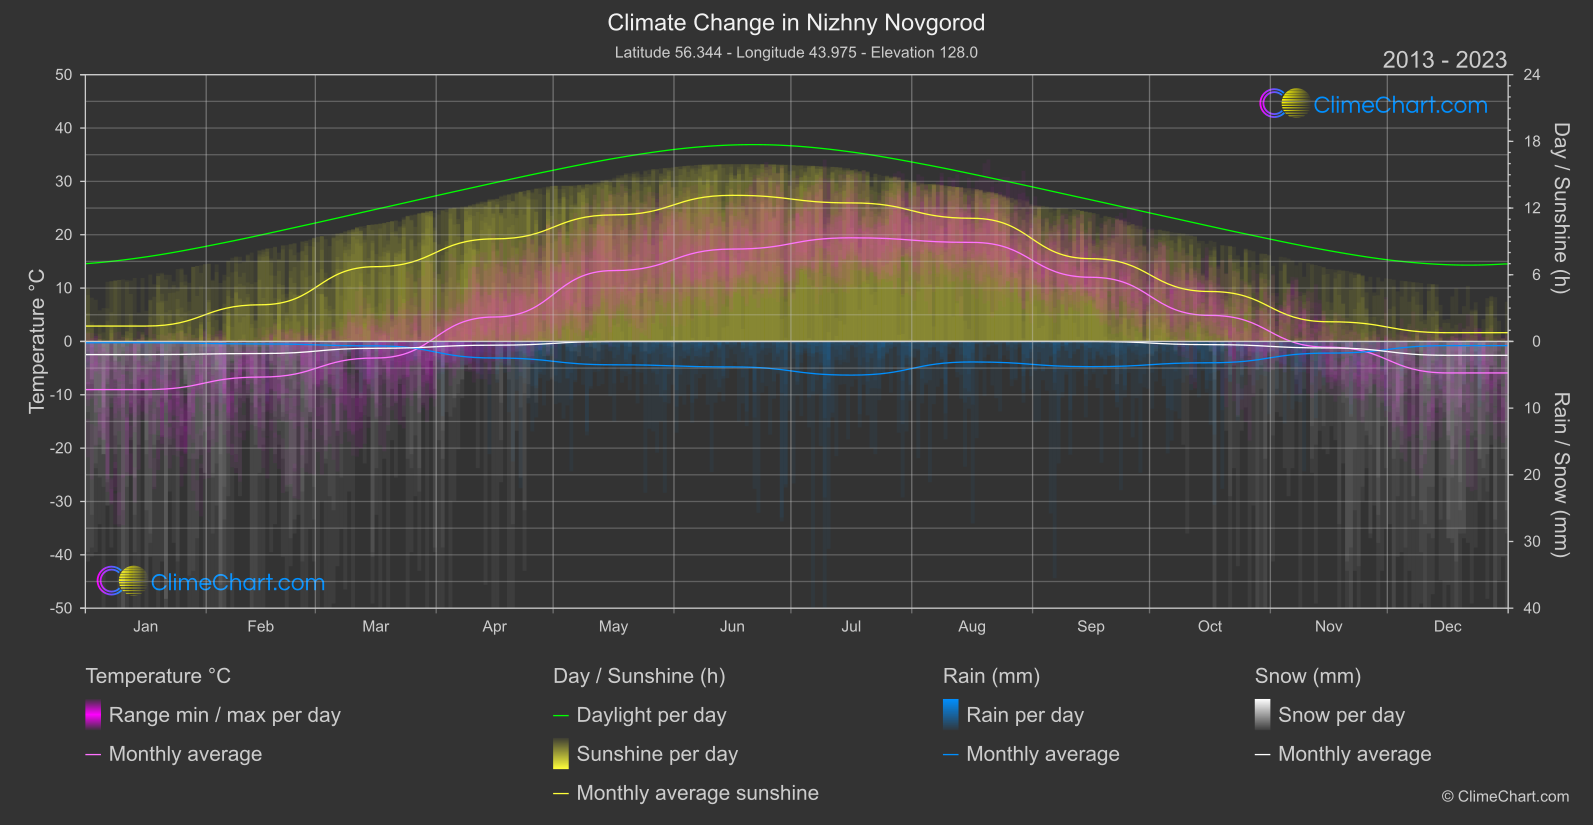
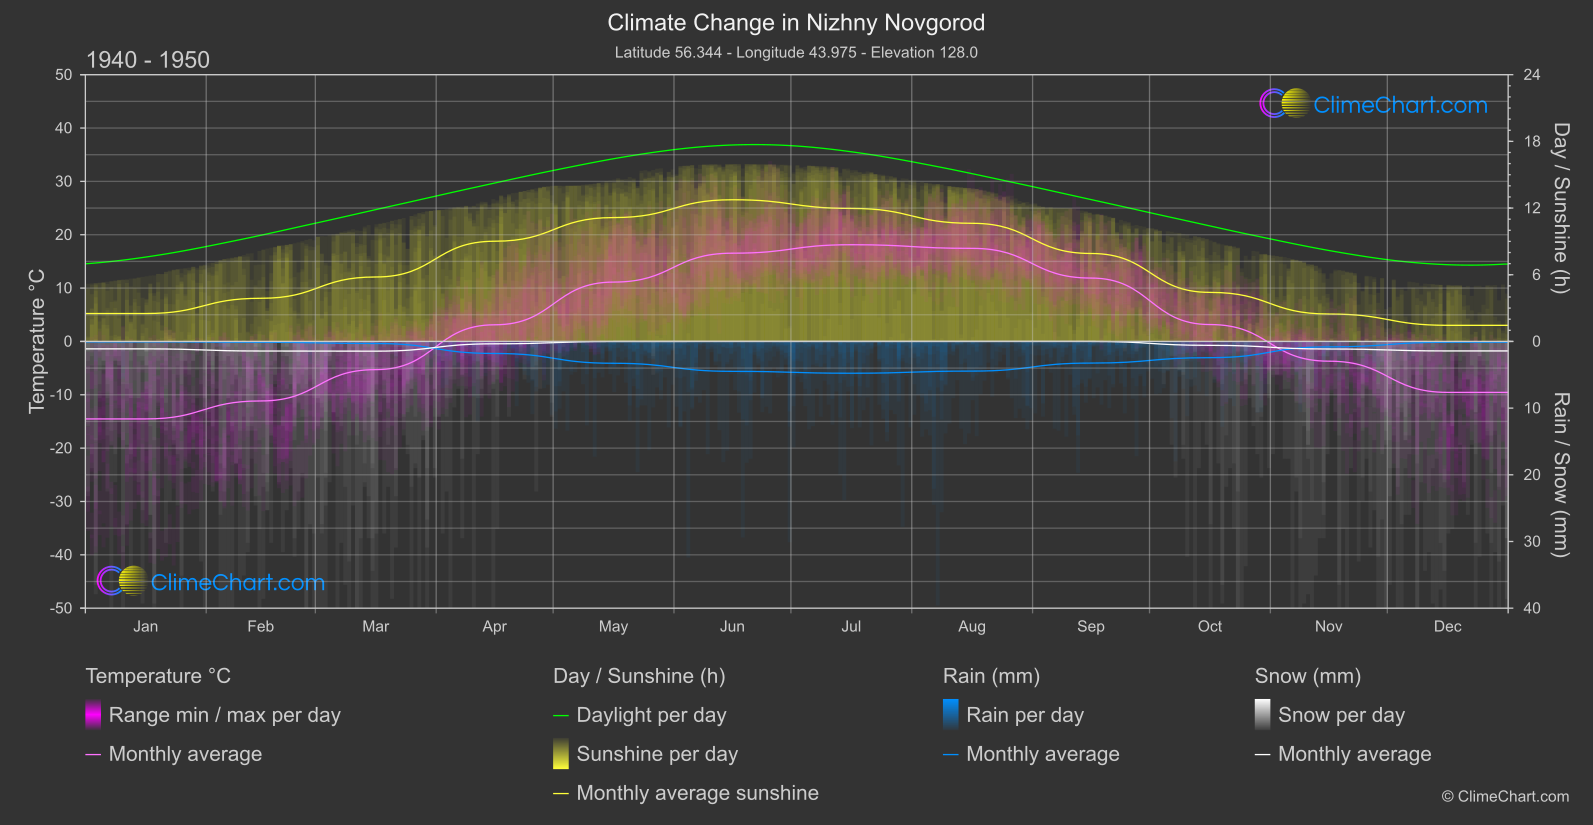
Nizhny Novgorod, located in Russia, has experienced notable climate changes over the years. From the data, it is observed that the months of May and July show the highest temperature changes, while November has the highest change in rainfall. Snowfall has decreased significantly compared to the past, and sunshine duration has shown varying trends throughout the year.
Climate Change Data Overview for Nizhny Novgorod, Russian Federation
Explore the comprehensive climate change data for Nizhny Novgorod, Russian Federation. This detailed table provides valuable insights into temperature variations, precipitation levels, and seasonal changes influenced by climate change, helping you understand the unique weather patterns of this region.
Temperature °C
| Month | ⌀ 1940 - 1950 | ⌀ 2013 - 2023 | +/- |
|---|---|---|---|
| Jan | -14.53 | -9.03 | 5.50 |
| Feb | -11.16 | -6.68 | 4.48 |
| Mar | -5.29 | -3.11 | 2.18 |
| Apr | 3.12 | 4.58 | 1.47 |
| May | 11.12 | 13.28 | 2.16 |
| Jun | 16.54 | 17.31 | 0.77 |
| Jul | 18.13 | 19.42 | 1.30 |
| Aug | 17.45 | 18.56 | 1.12 |
| Sep | 11.88 | 12.03 | 0.15 |
| Oct | 3.16 | 4.88 | 1.72 |
| Nov | -3.70 | -1.09 | 2.61 |
| Dec | -9.55 | -5.91 | 3.65 |
| ⌀ Month | 3.10 | 5.36 | 2.26 |
Sunshine (h)
| Month | ⌀ 1940 - 1950 | ⌀ 2013 - 2023 | +/- |
|---|---|---|---|
| Jan | 2.51 | 1.38 | -1.13 |
| Feb | 3.88 | 3.30 | -0.58 |
| Mar | 5.80 | 6.73 | 0.93 |
| Apr | 9.02 | 9.23 | 0.21 |
| May | 11.14 | 11.38 | 0.24 |
| Jun | 12.75 | 13.15 | 0.40 |
| Jul | 11.97 | 12.46 | 0.50 |
| Aug | 10.63 | 11.08 | 0.45 |
| Sep | 7.91 | 7.45 | -0.47 |
| Oct | 4.41 | 4.49 | 0.08 |
| Nov | 2.47 | 1.77 | -0.70 |
| Dec | 1.45 | 0.78 | -0.66 |
| ⌀ Month | 6.99 | 6.93 | -0.06 |
Rain (mm)
| Month | ⌀ 1940 - 1950 | ⌀ 2013 - 2023 | +/- |
|---|---|---|---|
| Jan | 0.03 | 0.10 | 0.07 |
| Feb | 0.06 | 0.19 | 0.13 |
| Mar | 0.15 | 0.33 | 0.18 |
| Apr | 0.90 | 1.24 | 0.34 |
| May | 1.64 | 1.75 | 0.11 |
| Jun | 2.24 | 1.91 | -0.33 |
| Jul | 2.38 | 2.52 | 0.14 |
| Aug | 2.22 | 1.54 | -0.69 |
| Sep | 1.62 | 1.89 | 0.27 |
| Oct | 1.22 | 1.60 | 0.38 |
| Nov | 0.41 | 0.87 | 0.47 |
| Dec | 0.06 | 0.31 | 0.25 |
| ⌀ Month | 1.08 | 1.19 | 0.11 |
Snow (mm)
| Month | ⌀ 1940 - 1950 | ⌀ 2013 - 2023 | +/- |
|---|---|---|---|
| Jan | 0.56 | 0.99 | 0.43 |
| Feb | 0.72 | 0.91 | 0.19 |
| Mar | 0.73 | 0.51 | -0.22 |
| Apr | 0.18 | 0.28 | 0.10 |
| May | 0.00 | 0.00 | 0.00 |
| Jun | 0.00 | 0.00 | 0.00 |
| Jul | 0.00 | 0.00 | 0.00 |
| Aug | 0.00 | 0.00 | 0.00 |
| Sep | 0.00 | 0.00 | 0.00 |
| Oct | 0.29 | 0.24 | -0.05 |
| Nov | 0.57 | 0.49 | -0.08 |
| Dec | 0.71 | 1.04 | 0.33 |
| ⌀ Month | 0.31 | 0.37 | 0.06 |