Climate Change Chart of Niseko, Japan
Comprehensive Climate Change Chart of Niseko, Japan: Monthly Averages and Impact Trends
Discover the changing climate in Niseko, Japan, with insights into temperature, rainfall, snowfall, and sunshine duration. Explore how the climate has evolved from 1940 to 1950 compared to 2013 to 2024.
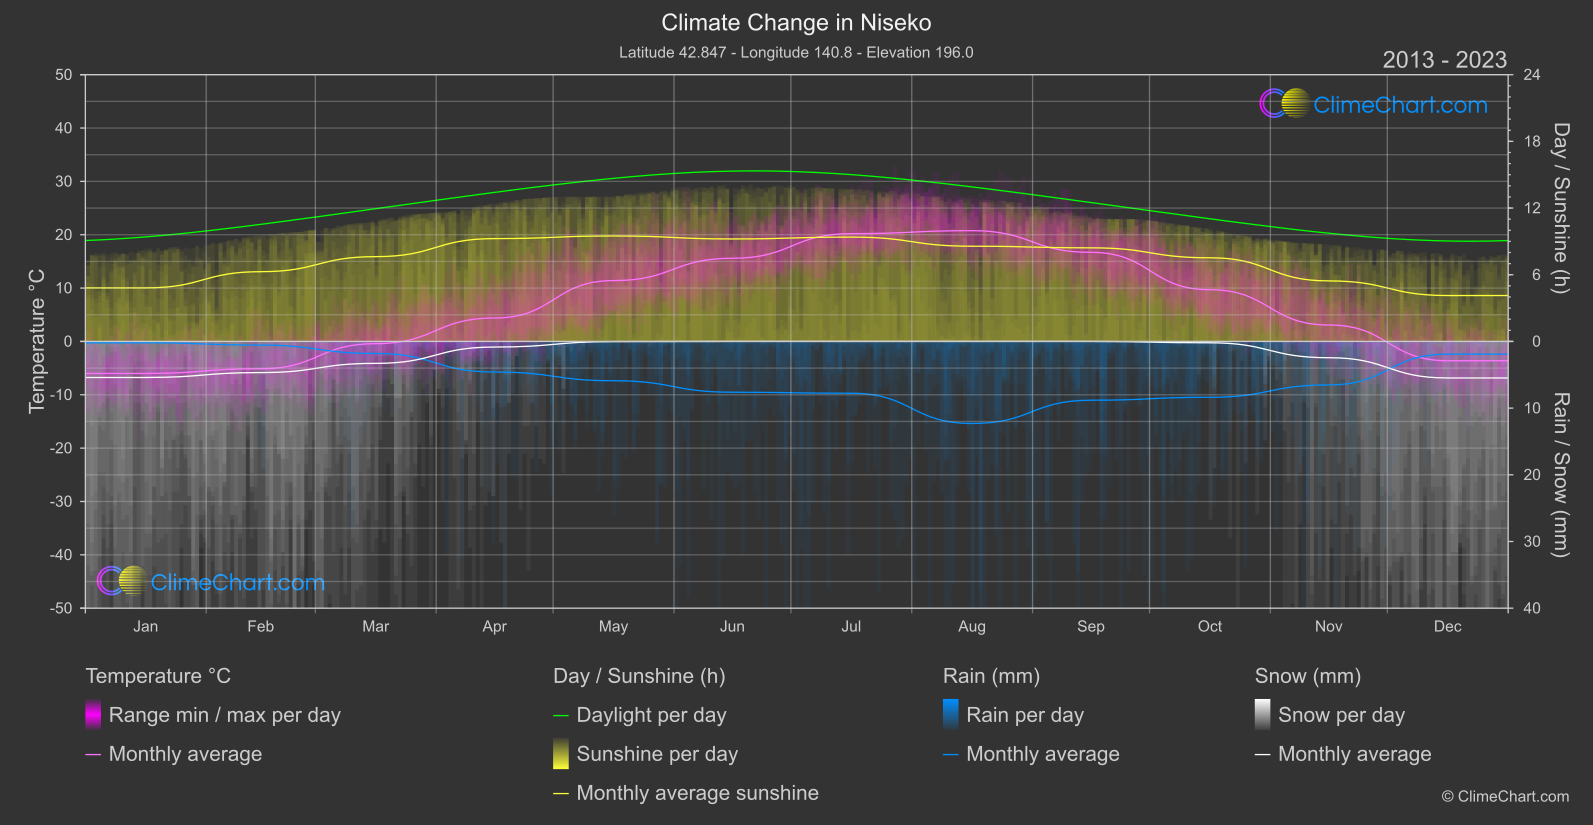
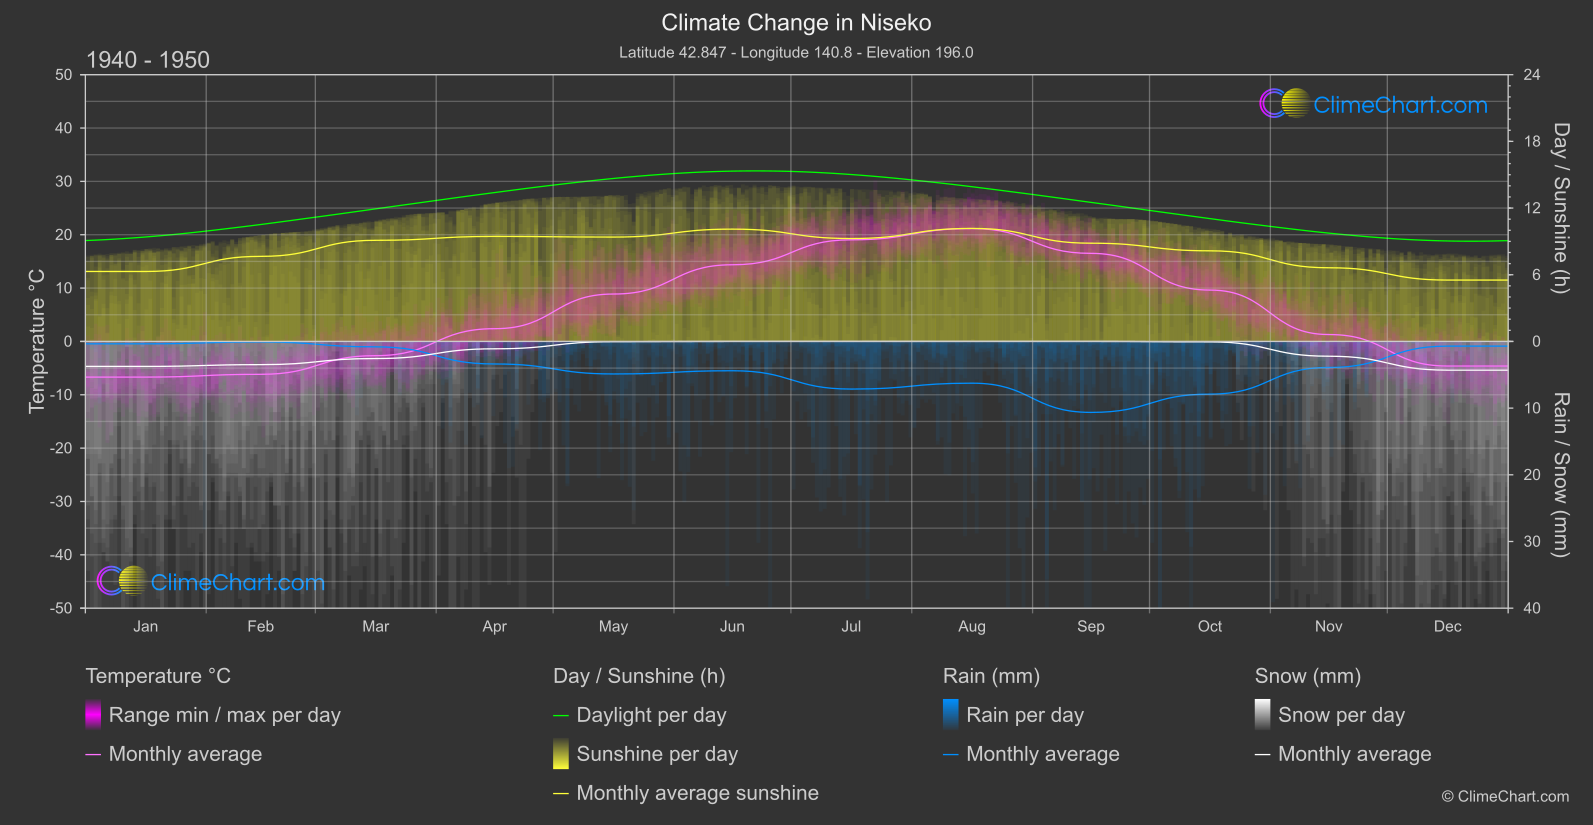
Niseko, Japan experiences notable changes in climate indicators over the years. In terms of temperature, June shows a slight increase of 1.22°C from 1940-1950 to 2013-2024, while August experiences a minor decrease of -0.39°C. Rainfall patterns also shift, with August witnessing a significant increase of 3.02mm compared to the same period. Snowfall, on the other hand, displays varying trends, with months like April showing a decrease of -0.13mm, while December sees an increase of 0.59mm. Sunshine duration fluctuates throughout the year, notably with January experiencing a decrease of -1.48 hours of sunshine.
Climate Change Data Overview for Niseko, Japan
Explore the comprehensive climate change data for Niseko, Japan. This detailed table provides valuable insights into temperature variations, precipitation levels, and seasonal changes influenced by climate change, helping you understand the unique weather patterns of this region.
Temperature °C
| Month | ⌀ 1940 - 1950 | ⌀ 2013 - 2023 | +/- |
|---|---|---|---|
| Jan | -6.68 | -6.00 | 0.69 |
| Feb | -6.16 | -5.12 | 1.04 |
| Mar | -2.66 | -0.42 | 2.25 |
| Apr | 2.39 | 4.39 | 2.00 |
| May | 8.88 | 11.40 | 2.52 |
| Jun | 14.37 | 15.59 | 1.22 |
| Jul | 19.05 | 20.21 | 1.16 |
| Aug | 21.15 | 20.76 | -0.39 |
| Sep | 16.51 | 16.70 | 0.19 |
| Oct | 9.63 | 9.69 | 0.06 |
| Nov | 1.29 | 3.08 | 1.79 |
| Dec | -4.61 | -3.62 | 0.99 |
| ⌀ Month | 6.10 | 7.22 | 1.13 |
Sunshine (h)
| Month | ⌀ 1940 - 1950 | ⌀ 2013 - 2023 | +/- |
|---|---|---|---|
| Jan | 6.29 | 4.82 | -1.48 |
| Feb | 7.65 | 6.28 | -1.38 |
| Mar | 9.10 | 7.63 | -1.47 |
| Apr | 9.45 | 9.25 | -0.20 |
| May | 9.39 | 9.49 | 0.10 |
| Jun | 10.10 | 9.22 | -0.88 |
| Jul | 9.26 | 9.39 | 0.13 |
| Aug | 10.17 | 8.57 | -1.60 |
| Sep | 8.84 | 8.42 | -0.42 |
| Oct | 8.15 | 7.53 | -0.63 |
| Nov | 6.63 | 5.45 | -1.18 |
| Dec | 5.52 | 4.13 | -1.39 |
| ⌀ Month | 8.38 | 7.51 | -0.87 |
Rain (mm)
| Month | ⌀ 1940 - 1950 | ⌀ 2013 - 2023 | +/- |
|---|---|---|---|
| Jan | 0.18 | 0.10 | -0.08 |
| Feb | 0.04 | 0.28 | 0.24 |
| Mar | 0.41 | 0.90 | 0.50 |
| Apr | 1.69 | 2.29 | 0.60 |
| May | 2.44 | 2.95 | 0.51 |
| Jun | 2.20 | 3.81 | 1.61 |
| Jul | 3.57 | 3.89 | 0.31 |
| Aug | 3.13 | 6.15 | 3.02 |
| Sep | 5.32 | 4.41 | -0.91 |
| Oct | 3.95 | 4.19 | 0.24 |
| Nov | 1.95 | 3.26 | 1.31 |
| Dec | 0.35 | 0.96 | 0.60 |
| ⌀ Month | 2.10 | 2.76 | 0.66 |
Snow (mm)
| Month | ⌀ 1940 - 1950 | ⌀ 2013 - 2023 | +/- |
|---|---|---|---|
| Jan | 1.87 | 2.70 | 0.83 |
| Feb | 1.74 | 2.34 | 0.60 |
| Mar | 1.28 | 1.64 | 0.36 |
| Apr | 0.55 | 0.42 | -0.13 |
| May | 0.02 | 0.01 | -0.01 |
| Jun | 0.00 | 0.00 | 0.00 |
| Jul | 0.00 | 0.00 | 0.00 |
| Aug | 0.00 | 0.00 | 0.00 |
| Sep | 0.00 | 0.00 | 0.00 |
| Oct | 0.03 | 0.10 | 0.07 |
| Nov | 1.11 | 1.22 | 0.11 |
| Dec | 2.15 | 2.74 | 0.59 |
| ⌀ Month | 0.73 | 0.93 | 0.20 |