Climate Change Chart of Nicosia, Cyprus
Comprehensive Climate Change Chart of Nicosia, Cyprus: Monthly Averages and Impact Trends
Exploring the changing climate in Nicosia, Cyprus reveals intriguing insights. Discover how temperatures and rainfall have evolved over the years.
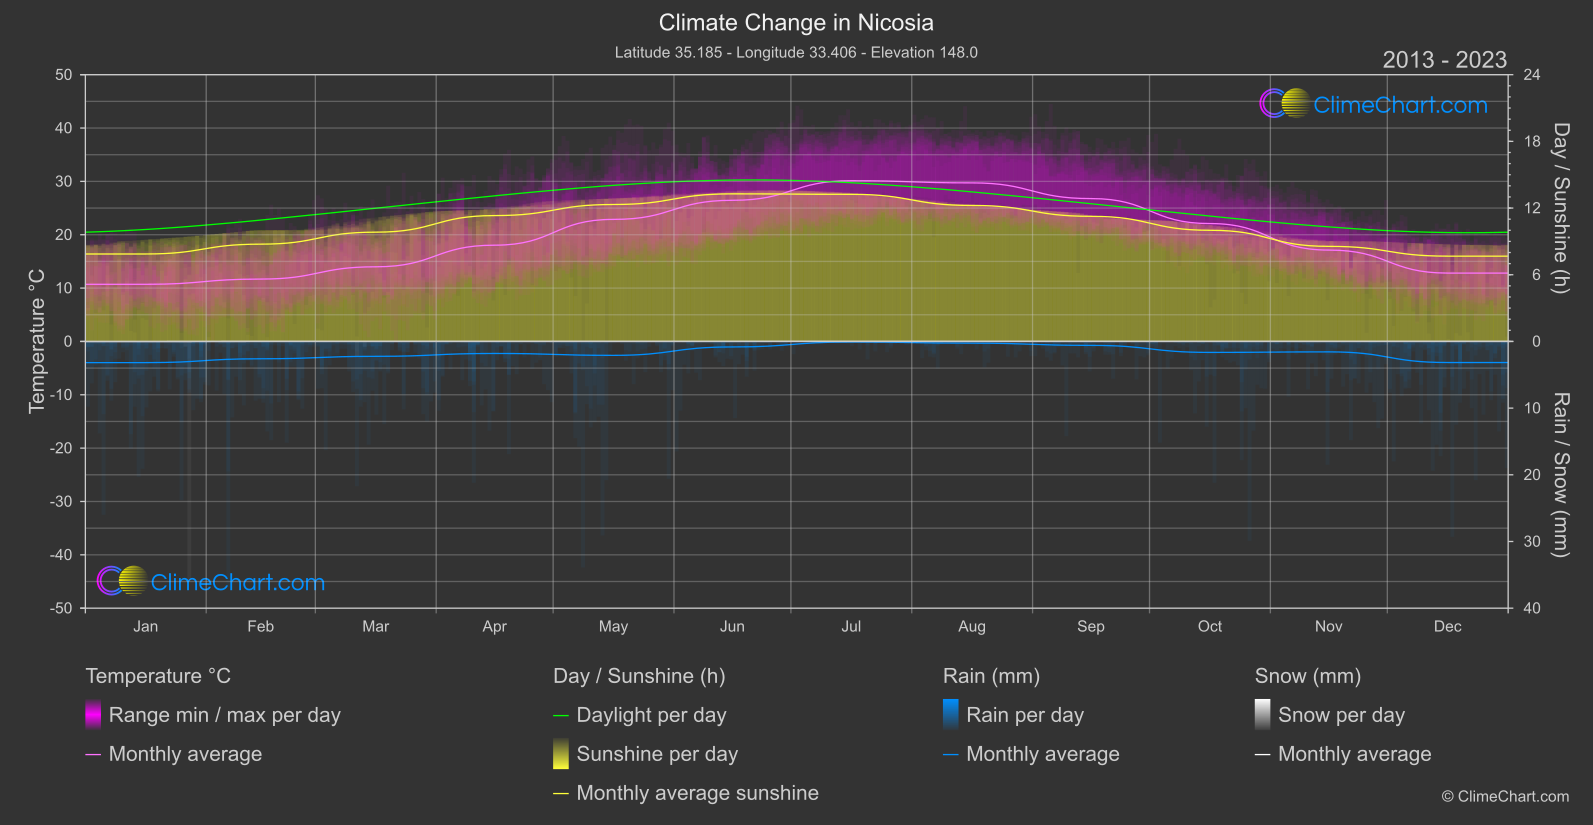
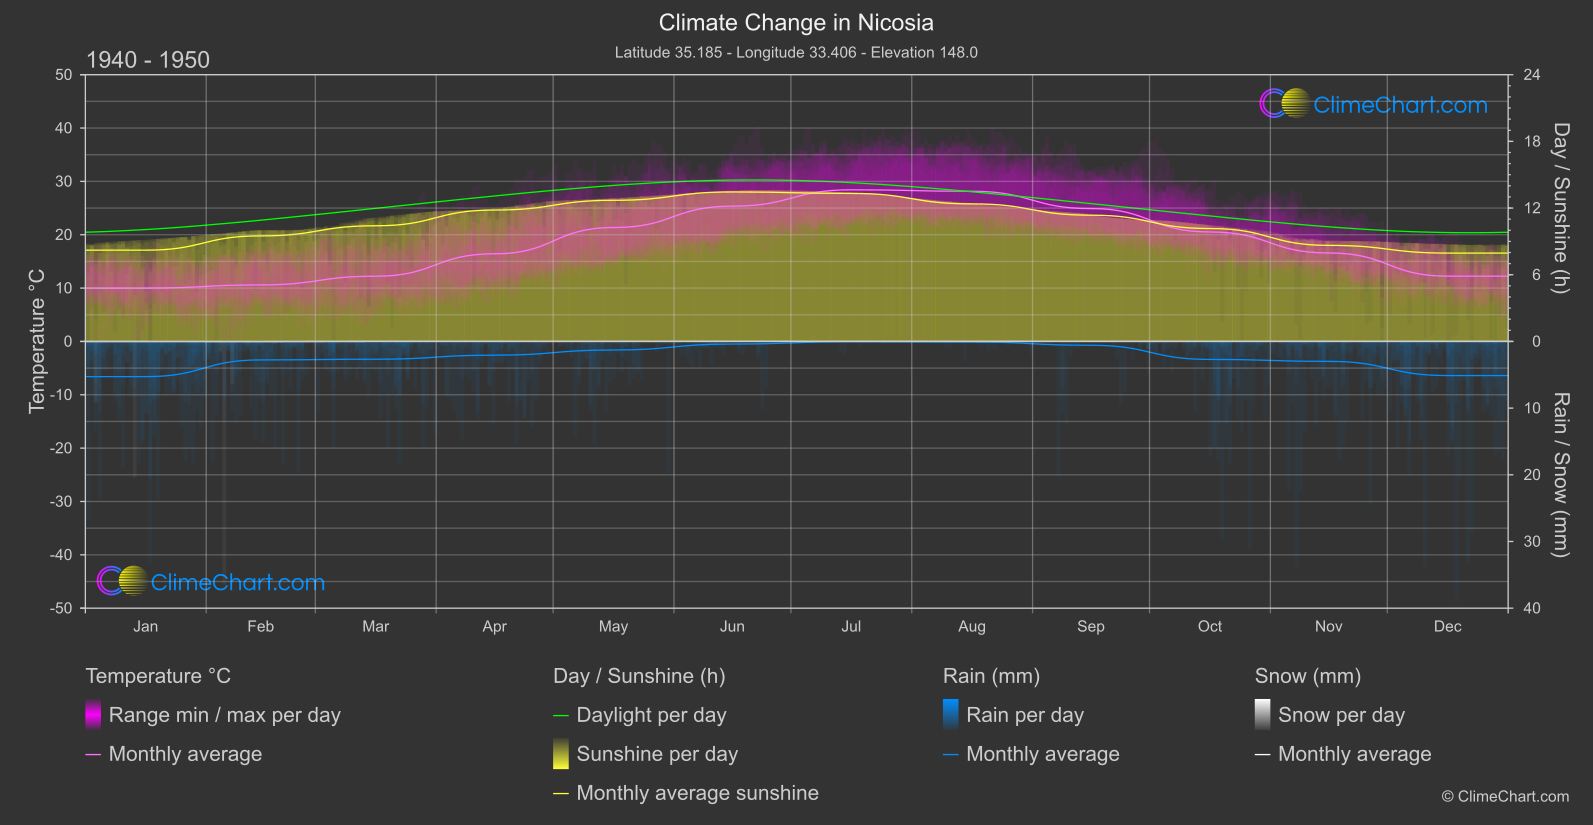
Nicosia, the capital of Cyprus, experiences noticeable changes in temperature and rainfall patterns. Analyzing the data from 1940 to 1950 compared to 2013 to 2024, it's evident that the month with the highest temperature change is September. During this month, the temperature rose by approximately 1.88°C. In terms of rainfall, the month with the most significant change is October, with a decrease of around 0.52mm. Snowfall and sunshine duration also show varying trends, reflecting the evolving climate dynamics in Nicosia.
Climate Change Data Overview for Nicosia, Cyprus
Explore the comprehensive climate change data for Nicosia, Cyprus. This detailed table provides valuable insights into temperature variations, precipitation levels, and seasonal changes influenced by climate change, helping you understand the unique weather patterns of this region.
Temperature °C
| Month | ⌀ 1940 - 1950 | ⌀ 2013 - 2023 | +/- |
|---|---|---|---|
| Jan | 10.00 | 10.71 | 0.71 |
| Feb | 10.59 | 11.69 | 1.09 |
| Mar | 12.22 | 13.99 | 1.76 |
| Apr | 16.43 | 18.04 | 1.61 |
| May | 21.35 | 22.88 | 1.53 |
| Jun | 25.36 | 26.45 | 1.09 |
| Jul | 28.42 | 30.12 | 1.70 |
| Aug | 28.15 | 29.72 | 1.57 |
| Sep | 24.90 | 26.78 | 1.88 |
| Oct | 20.52 | 22.09 | 1.57 |
| Nov | 16.58 | 17.12 | 0.54 |
| Dec | 12.24 | 12.81 | 0.57 |
| ⌀ Month | 18.90 | 20.20 | 1.30 |
Sunshine (h)
| Month | ⌀ 1940 - 1950 | ⌀ 2013 - 2023 | +/- |
|---|---|---|---|
| Jan | 8.21 | 7.87 | -0.34 |
| Feb | 9.50 | 8.75 | -0.74 |
| Mar | 10.41 | 9.83 | -0.57 |
| Apr | 11.82 | 11.32 | -0.50 |
| May | 12.70 | 12.32 | -0.38 |
| Jun | 13.45 | 13.28 | -0.17 |
| Jul | 13.32 | 13.23 | -0.08 |
| Aug | 12.38 | 12.23 | -0.14 |
| Sep | 11.36 | 11.26 | -0.10 |
| Oct | 10.16 | 10.00 | -0.16 |
| Nov | 8.64 | 8.55 | -0.09 |
| Dec | 7.95 | 7.67 | -0.27 |
| ⌀ Month | 10.82 | 10.53 | -0.30 |
Rain (mm)
| Month | ⌀ 1940 - 1950 | ⌀ 2013 - 2023 | +/- |
|---|---|---|---|
| Jan | 2.64 | 1.59 | -1.05 |
| Feb | 1.39 | 1.30 | -0.08 |
| Mar | 1.33 | 1.12 | -0.22 |
| Apr | 1.03 | 0.90 | -0.13 |
| May | 0.64 | 1.04 | 0.40 |
| Jun | 0.20 | 0.41 | 0.22 |
| Jul | 0.02 | 0.04 | 0.02 |
| Aug | 0.04 | 0.13 | 0.09 |
| Sep | 0.29 | 0.30 | 0.01 |
| Oct | 1.35 | 0.82 | -0.52 |
| Nov | 1.49 | 0.78 | -0.71 |
| Dec | 2.56 | 1.58 | -0.98 |
| ⌀ Month | 1.08 | 0.84 | -0.25 |
Snow (mm)
| Month | ⌀ 1940 - 1950 | ⌀ 2013 - 2023 | +/- |
|---|---|---|---|
| Jan | 0.01 | 0.01 | 0.00 |
| Feb | 0.01 | 0.00 | -0.01 |
| Mar | 0.00 | 0.00 | 0.00 |
| Apr | 0.00 | 0.00 | 0.00 |
| May | 0.00 | 0.00 | 0.00 |
| Jun | 0.00 | 0.00 | 0.00 |
| Jul | 0.00 | 0.00 | 0.00 |
| Aug | 0.00 | 0.00 | 0.00 |
| Sep | 0.00 | 0.00 | 0.00 |
| Oct | 0.00 | 0.00 | 0.00 |
| Nov | 0.00 | 0.00 | 0.00 |
| Dec | 0.00 | 0.00 | 0.00 |
| ⌀ Month | 0.00 | 0.00 | -0.00 |