Climate Change Chart of Nice, France
Comprehensive Climate Change Chart of Nice, France: Monthly Averages and Impact Trends
Explore the changing climate in Nice, France with insightful data analysis.
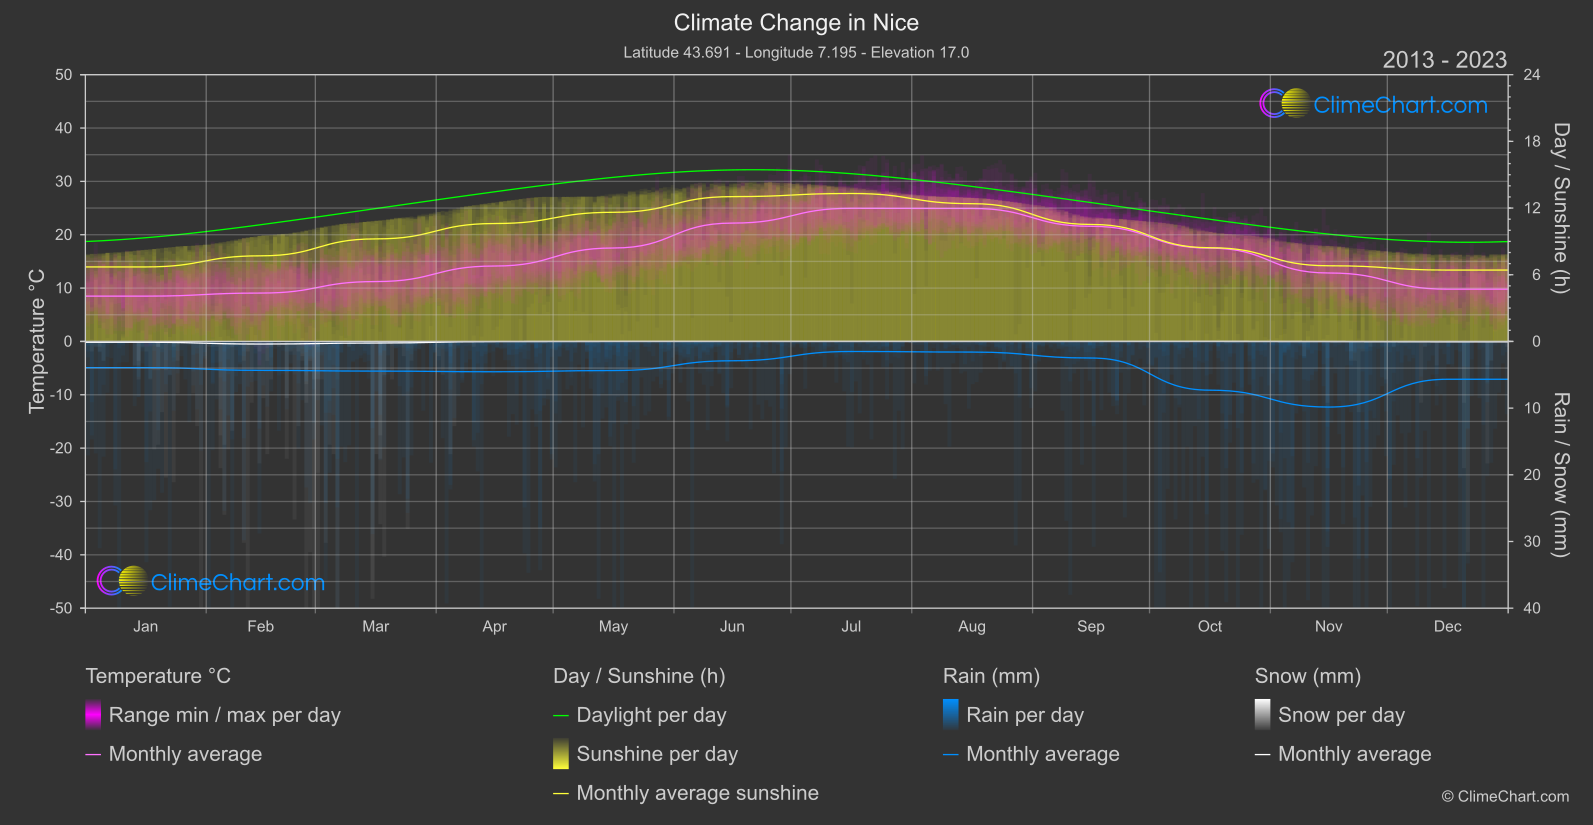
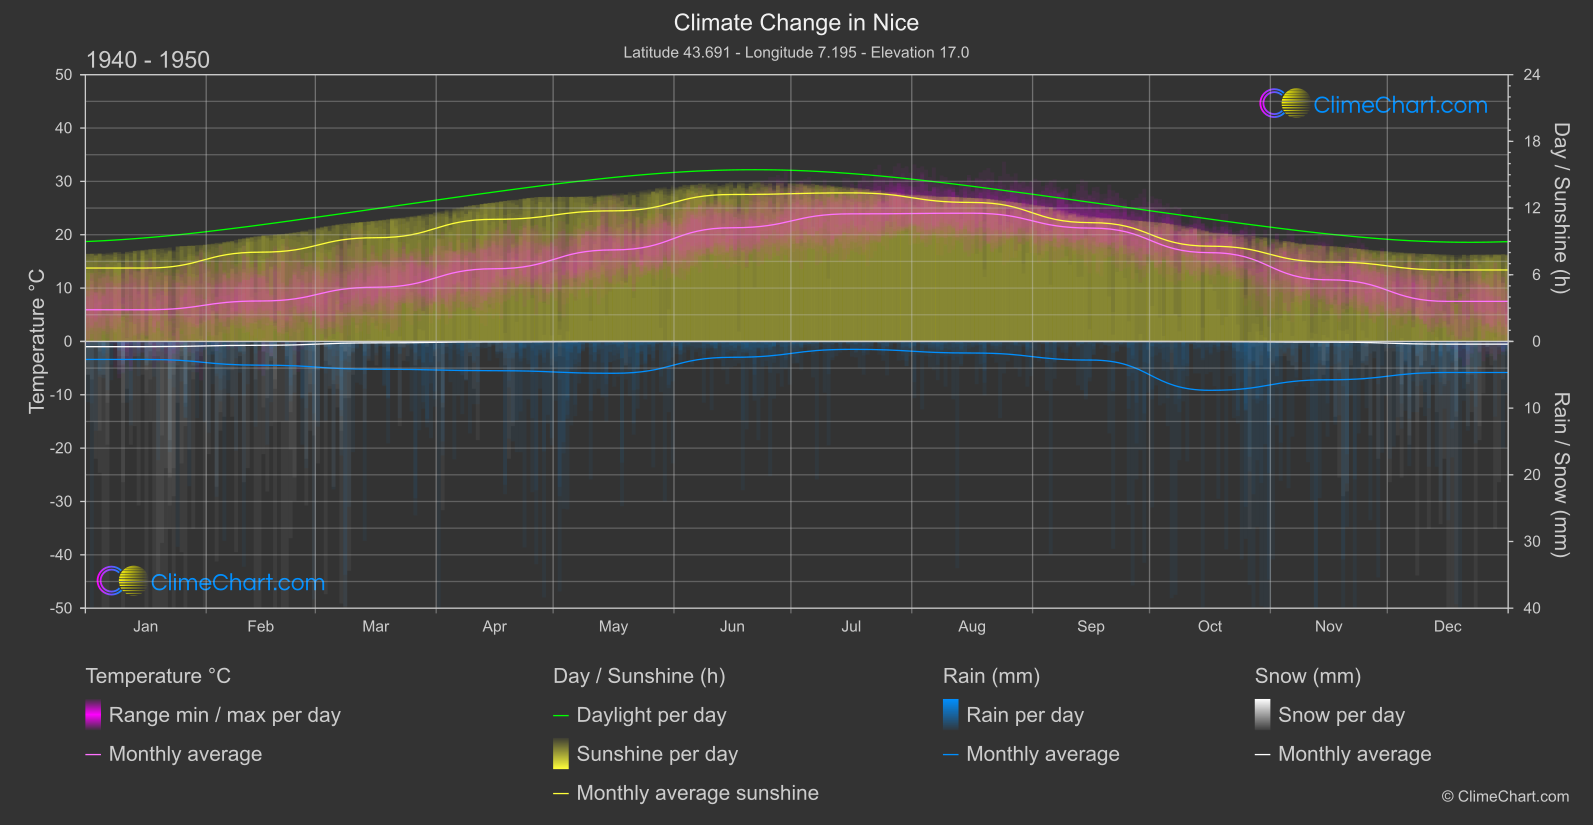
Nice, a city known for its beautiful Mediterranean climate, is experiencing significant changes in temperature, rainfall, snowfall, and sunshine duration. Analyzing the data from 1940 - 1950 compared to 2013 - 2024 reveals intriguing insights. For instance, January saw the highest temperature change of 2.56°C, while November experienced a substantial rainfall increase of 2.05mm. Discover more fascinating trends in the climate of Nice, France.
Climate Change Data Overview for Nice, France
Explore the comprehensive climate change data for Nice, France. This detailed table provides valuable insights into temperature variations, precipitation levels, and seasonal changes influenced by climate change, helping you understand the unique weather patterns of this region.
Temperature °C
| Month | ⌀ 1940 - 1950 | ⌀ 2013 - 2023 | +/- |
|---|---|---|---|
| Jan | 5.93 | 8.49 | 2.56 |
| Feb | 7.58 | 9.07 | 1.49 |
| Mar | 10.16 | 11.22 | 1.06 |
| Apr | 13.62 | 14.13 | 0.51 |
| May | 17.16 | 17.51 | 0.35 |
| Jun | 21.31 | 22.18 | 0.87 |
| Jul | 23.92 | 24.95 | 1.04 |
| Aug | 24.03 | 24.92 | 0.89 |
| Sep | 21.25 | 21.58 | 0.33 |
| Oct | 16.64 | 17.48 | 0.85 |
| Nov | 11.55 | 12.83 | 1.28 |
| Dec | 7.51 | 9.79 | 2.29 |
| ⌀ Month | 15.05 | 16.18 | 1.13 |
Sunshine (h)
| Month | ⌀ 1940 - 1950 | ⌀ 2013 - 2023 | +/- |
|---|---|---|---|
| Jan | 6.60 | 6.70 | 0.10 |
| Feb | 8.03 | 7.70 | -0.33 |
| Mar | 9.33 | 9.22 | -0.11 |
| Apr | 10.99 | 10.61 | -0.38 |
| May | 11.75 | 11.62 | -0.13 |
| Jun | 13.22 | 13.03 | -0.19 |
| Jul | 13.36 | 13.31 | -0.05 |
| Aug | 12.51 | 12.39 | -0.11 |
| Sep | 10.69 | 10.53 | -0.16 |
| Oct | 8.57 | 8.43 | -0.14 |
| Nov | 7.14 | 6.81 | -0.34 |
| Dec | 6.43 | 6.42 | -0.01 |
| ⌀ Month | 9.89 | 9.73 | -0.15 |
Rain (mm)
| Month | ⌀ 1940 - 1950 | ⌀ 2013 - 2023 | +/- |
|---|---|---|---|
| Jan | 1.35 | 1.96 | 0.61 |
| Feb | 1.78 | 2.17 | 0.39 |
| Mar | 2.08 | 2.22 | 0.14 |
| Apr | 2.19 | 2.27 | 0.08 |
| May | 2.39 | 2.18 | -0.21 |
| Jun | 1.19 | 1.45 | 0.26 |
| Jul | 0.59 | 0.75 | 0.16 |
| Aug | 0.87 | 0.80 | -0.07 |
| Sep | 1.40 | 1.24 | -0.15 |
| Oct | 3.67 | 3.66 | -0.01 |
| Nov | 2.87 | 4.92 | 2.05 |
| Dec | 2.33 | 2.84 | 0.51 |
| ⌀ Month | 1.89 | 2.21 | 0.31 |
Snow (mm)
| Month | ⌀ 1940 - 1950 | ⌀ 2013 - 2023 | +/- |
|---|---|---|---|
| Jan | 0.39 | 0.06 | -0.33 |
| Feb | 0.29 | 0.20 | -0.09 |
| Mar | 0.11 | 0.12 | 0.01 |
| Apr | 0.03 | 0.01 | -0.02 |
| May | 0.00 | 0.00 | -0.00 |
| Jun | 0.00 | 0.00 | 0.00 |
| Jul | 0.00 | 0.00 | 0.00 |
| Aug | 0.00 | 0.00 | 0.00 |
| Sep | 0.00 | 0.00 | 0.00 |
| Oct | 0.01 | 0.00 | -0.01 |
| Nov | 0.05 | 0.01 | -0.04 |
| Dec | 0.20 | 0.03 | -0.17 |
| ⌀ Month | 0.09 | 0.04 | -0.05 |