Climate Change Chart of Nha Trang, Viet Nam
Comprehensive Climate Change Chart of Nha Trang, Viet Nam: Monthly Averages and Impact Trends
Discover how the climate in Nha Trang, Viet Nam has evolved over the years with detailed insights on temperature, rainfall, and sunshine duration changes.
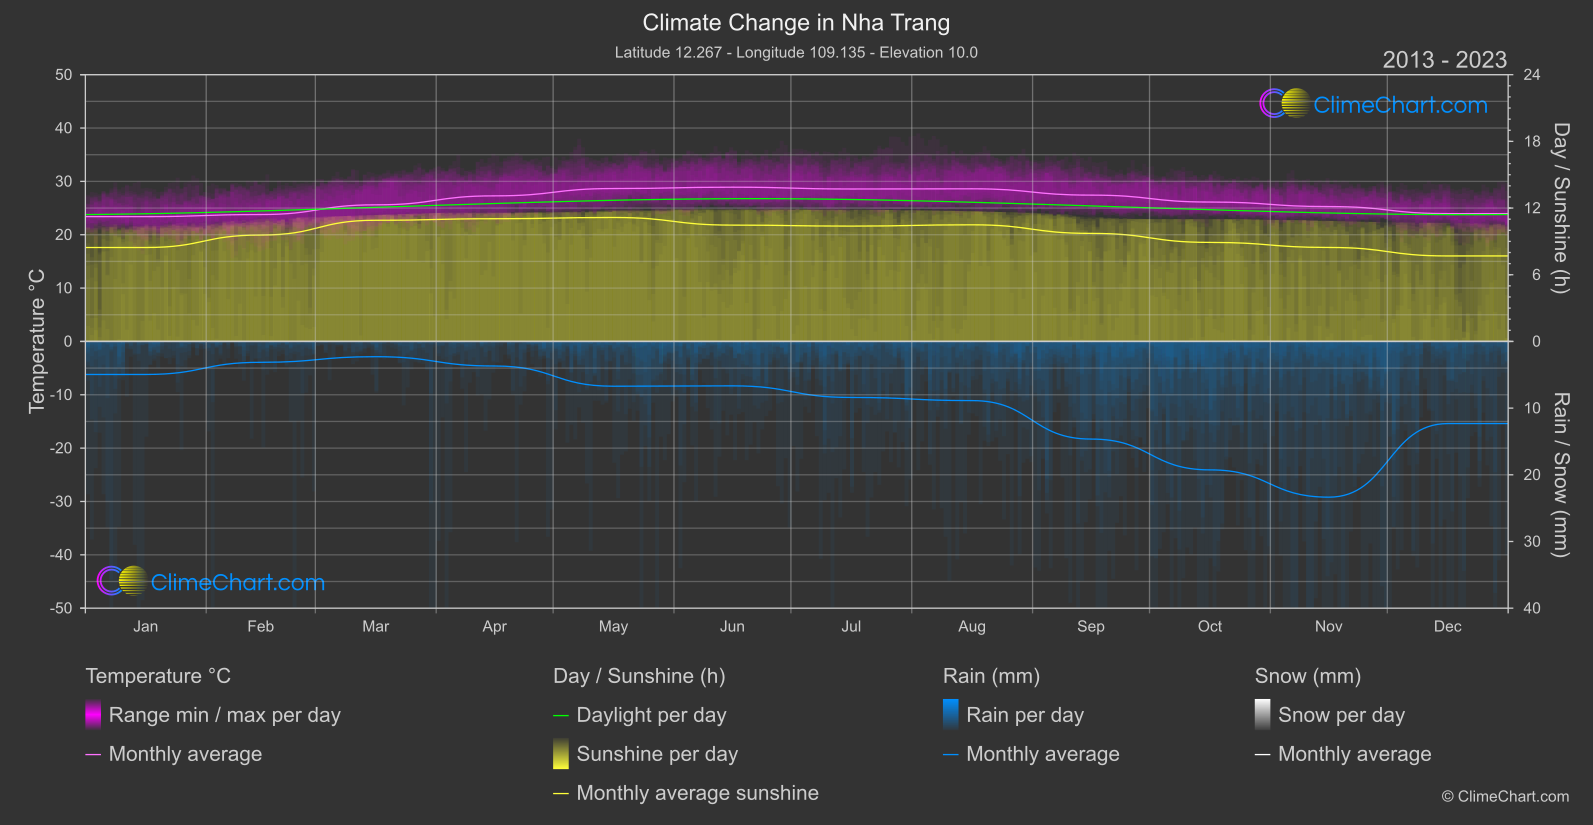
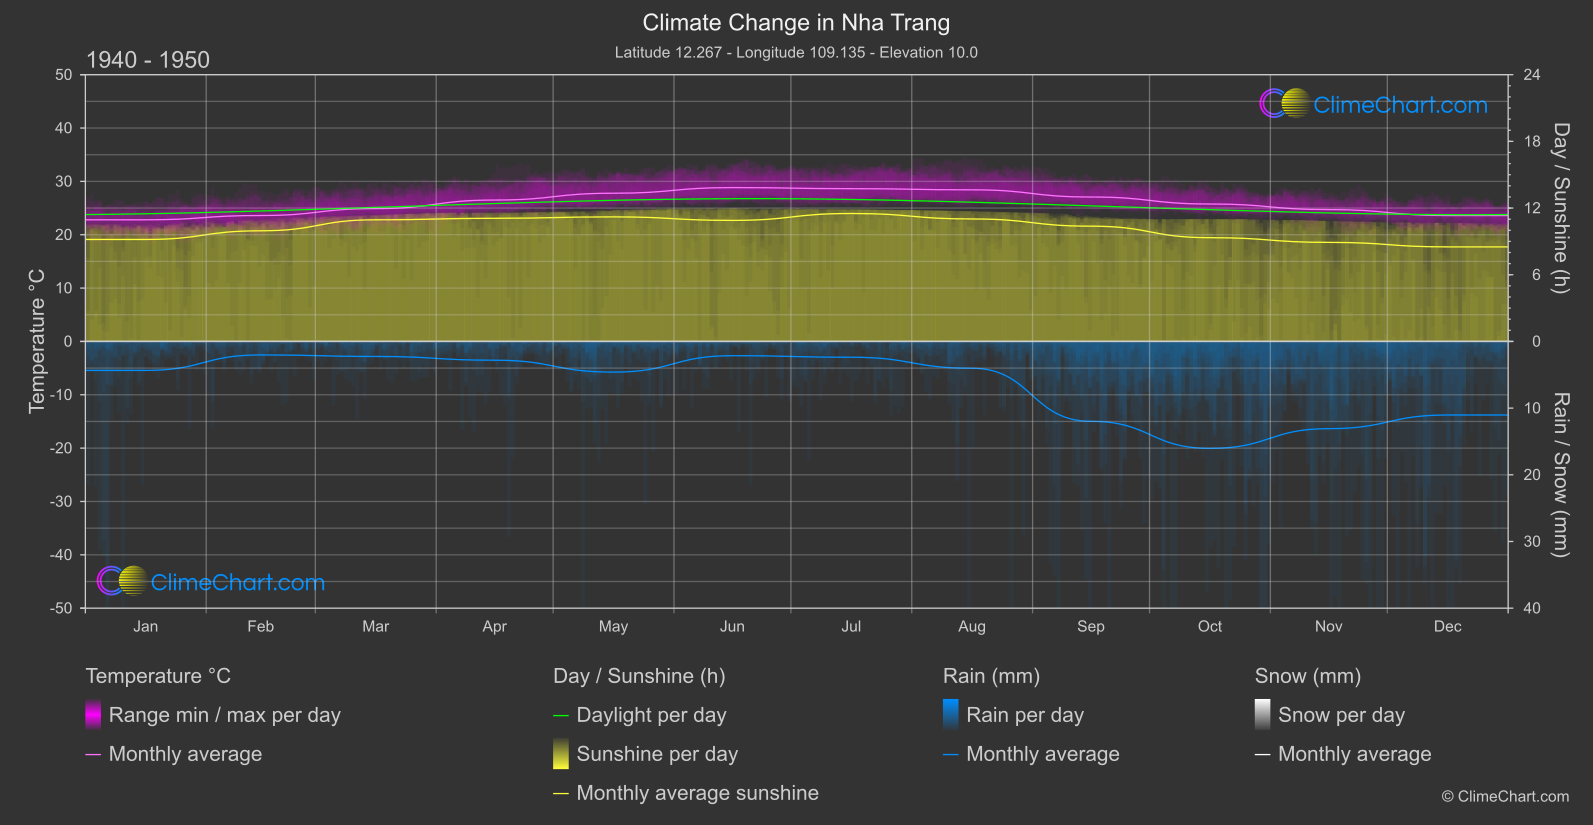
Nha Trang, located in Viet Nam, has experienced notable changes in climate parameters like temperature, rainfall, and sunshine duration over the years. The data shows varying trends across different months, with significant shifts in temperature and rainfall. For instance, the month with the highest temperature change is May, while November sees the largest increase in rainfall. Understanding these climate shifts is crucial for preparing and adapting to a changing environment.
Climate Change Data Overview for Nha Trang, Viet Nam
Explore the comprehensive climate change data for Nha Trang, Viet Nam. This detailed table provides valuable insights into temperature variations, precipitation levels, and seasonal changes influenced by climate change, helping you understand the unique weather patterns of this region.
Temperature °C
| Month | ⌀ 1940 - 1950 | ⌀ 2013 - 2023 | +/- |
|---|---|---|---|
| Jan | 22.80 | 23.39 | 0.59 |
| Feb | 23.60 | 23.79 | 0.18 |
| Mar | 24.90 | 25.61 | 0.71 |
| Apr | 26.51 | 27.29 | 0.78 |
| May | 27.78 | 28.66 | 0.88 |
| Jun | 28.84 | 28.91 | 0.07 |
| Jul | 28.63 | 28.57 | -0.06 |
| Aug | 28.42 | 28.61 | 0.19 |
| Sep | 27.07 | 27.42 | 0.35 |
| Oct | 25.76 | 26.13 | 0.37 |
| Nov | 24.71 | 25.28 | 0.57 |
| Dec | 23.60 | 23.96 | 0.36 |
| ⌀ Month | 26.05 | 26.47 | 0.42 |
Sunshine (h)
| Month | ⌀ 1940 - 1950 | ⌀ 2013 - 2023 | +/- |
|---|---|---|---|
| Jan | 9.17 | 8.45 | -0.72 |
| Feb | 9.95 | 9.57 | -0.38 |
| Mar | 10.94 | 10.90 | -0.04 |
| Apr | 11.08 | 11.04 | -0.04 |
| May | 11.21 | 11.15 | -0.05 |
| Jun | 10.89 | 10.47 | -0.42 |
| Jul | 11.51 | 10.38 | -1.13 |
| Aug | 11.02 | 10.49 | -0.53 |
| Sep | 10.37 | 9.72 | -0.65 |
| Oct | 9.33 | 8.91 | -0.42 |
| Nov | 8.91 | 8.46 | -0.46 |
| Dec | 8.51 | 7.69 | -0.81 |
| ⌀ Month | 10.24 | 9.77 | -0.47 |
Rain (mm)
| Month | ⌀ 1940 - 1950 | ⌀ 2013 - 2023 | +/- |
|---|---|---|---|
| Jan | 2.17 | 2.48 | 0.30 |
| Feb | 1.01 | 1.57 | 0.55 |
| Mar | 1.13 | 1.14 | 0.02 |
| Apr | 1.41 | 1.84 | 0.43 |
| May | 2.30 | 3.36 | 1.06 |
| Jun | 1.07 | 3.33 | 2.26 |
| Jul | 1.18 | 4.20 | 3.02 |
| Aug | 2.01 | 4.44 | 2.43 |
| Sep | 5.99 | 7.32 | 1.33 |
| Oct | 8.02 | 9.63 | 1.61 |
| Nov | 6.54 | 11.68 | 5.14 |
| Dec | 5.52 | 6.16 | 0.64 |
| ⌀ Month | 3.20 | 4.76 | 1.57 |
Snow (mm)
| Month | ⌀ 1940 - 1950 | ⌀ 2013 - 2023 | +/- |
|---|---|---|---|
| Jan | 0.00 | 0.00 | 0.00 |
| Feb | 0.00 | 0.00 | 0.00 |
| Mar | 0.00 | 0.00 | 0.00 |
| Apr | 0.00 | 0.00 | 0.00 |
| May | 0.00 | 0.00 | 0.00 |
| Jun | 0.00 | 0.00 | 0.00 |
| Jul | 0.00 | 0.00 | 0.00 |
| Aug | 0.00 | 0.00 | 0.00 |
| Sep | 0.00 | 0.00 | 0.00 |
| Oct | 0.00 | 0.00 | 0.00 |
| Nov | 0.00 | 0.00 | 0.00 |
| Dec | 0.00 | 0.00 | 0.00 |
| ⌀ Month | 0.00 | 0.00 | 0.00 |