Climate Change Chart of Nezahualcoyotl, Mexico
Comprehensive Climate Change Chart of Nezahualcoyotl, Mexico: Monthly Averages and Impact Trends
Exploring the changing climate patterns in Nezahualcoyotl, Mexico reveals intriguing insights into the temperature, rainfall, and sunshine duration trends over the years.
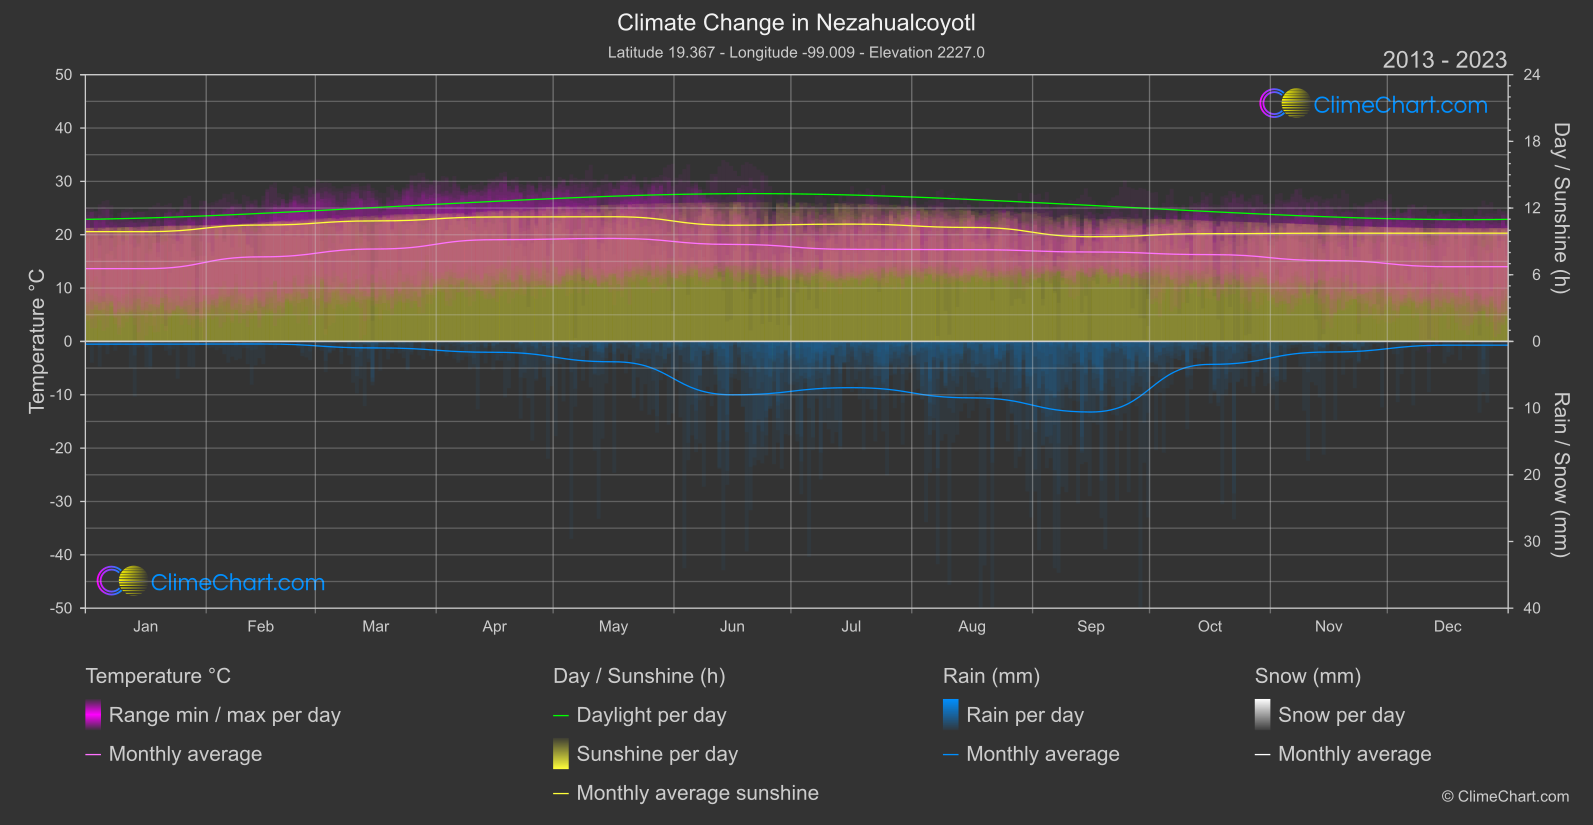
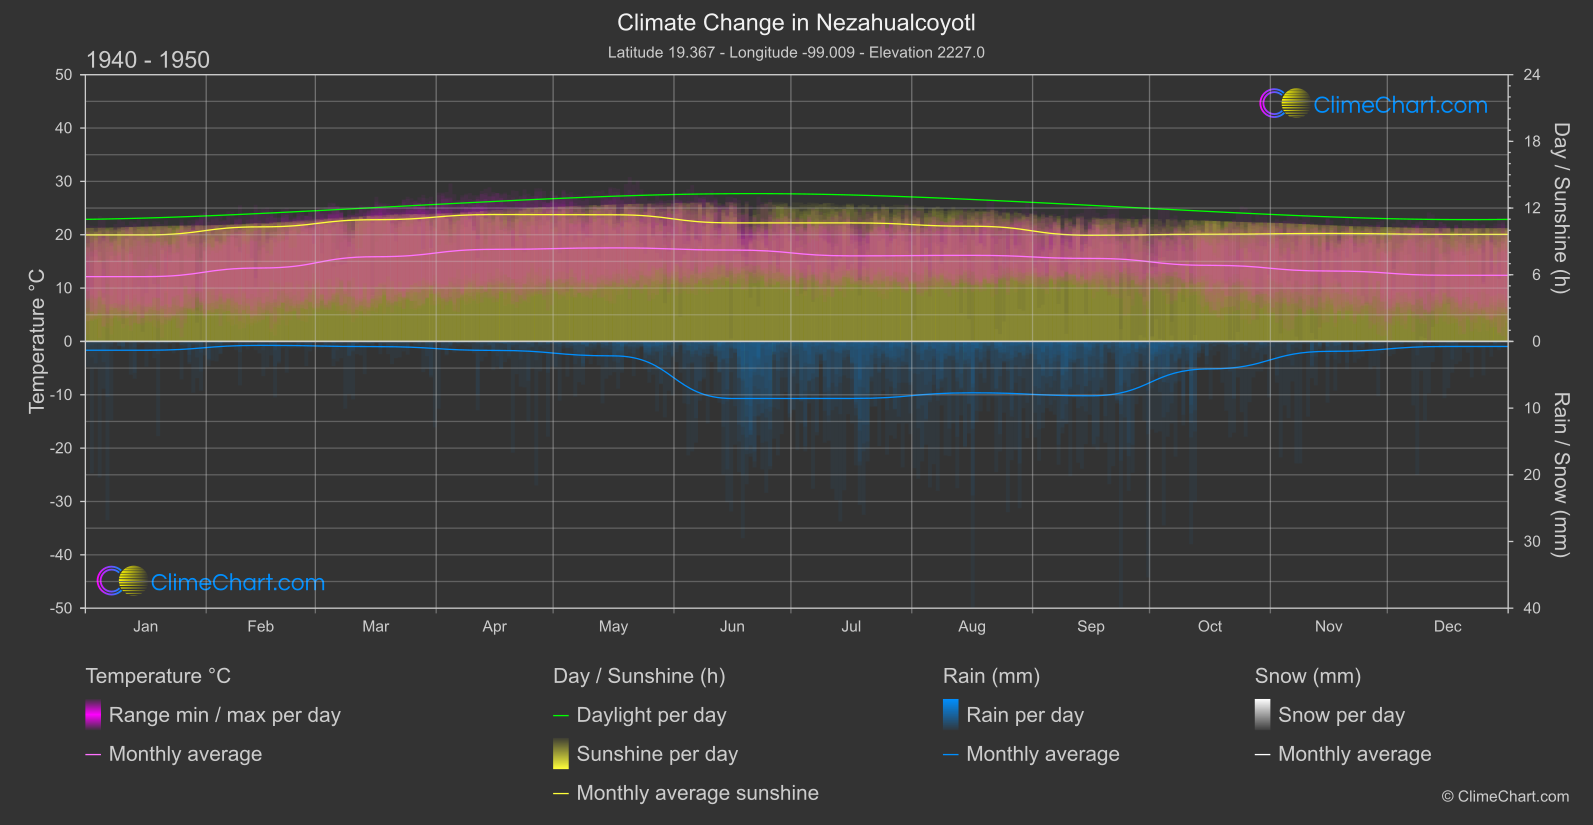
Nezahualcoyotl, Mexico experiences significant changes in temperature, with the highest temperature change observed in October between the periods 1940-1950 and 2013-2024. The data also shows fluctuations in rainfall, with the most notable change occurring in September. Additionally, there is a noticeable shift in sunshine duration, particularly in April and May. These insights highlight the evolving climate patterns in Nezahualcoyotl, Mexico, emphasizing the need for continuous monitoring and adaptation strategies.
Climate Change Data Overview for Nezahualcoyotl, Mexico
Explore the comprehensive climate change data for Nezahualcoyotl, Mexico. This detailed table provides valuable insights into temperature variations, precipitation levels, and seasonal changes influenced by climate change, helping you understand the unique weather patterns of this region.
Temperature °C
| Month | ⌀ 1940 - 1950 | ⌀ 2013 - 2023 | +/- |
|---|---|---|---|
| Jan | 12.15 | 13.65 | 1.50 |
| Feb | 13.76 | 15.86 | 2.09 |
| Mar | 15.88 | 17.33 | 1.45 |
| Apr | 17.26 | 19.07 | 1.81 |
| May | 17.53 | 19.30 | 1.77 |
| Jun | 17.13 | 18.18 | 1.05 |
| Jul | 16.04 | 17.26 | 1.22 |
| Aug | 16.13 | 17.19 | 1.06 |
| Sep | 15.56 | 16.77 | 1.20 |
| Oct | 14.26 | 16.27 | 2.01 |
| Nov | 13.20 | 15.15 | 1.95 |
| Dec | 12.40 | 14.01 | 1.62 |
| ⌀ Month | 15.11 | 16.67 | 1.56 |
Sunshine (h)
| Month | ⌀ 1940 - 1950 | ⌀ 2013 - 2023 | +/- |
|---|---|---|---|
| Jan | 9.59 | 9.88 | 0.29 |
| Feb | 10.31 | 10.47 | 0.16 |
| Mar | 10.95 | 10.84 | -0.11 |
| Apr | 11.42 | 11.20 | -0.22 |
| May | 11.39 | 11.22 | -0.18 |
| Jun | 10.67 | 10.45 | -0.21 |
| Jul | 10.66 | 10.56 | -0.11 |
| Aug | 10.36 | 10.26 | -0.11 |
| Sep | 9.55 | 9.42 | -0.13 |
| Oct | 9.64 | 9.69 | 0.05 |
| Nov | 9.71 | 9.74 | 0.02 |
| Dec | 9.63 | 9.74 | 0.11 |
| ⌀ Month | 10.32 | 10.29 | -0.04 |
Rain (mm)
| Month | ⌀ 1940 - 1950 | ⌀ 2013 - 2023 | +/- |
|---|---|---|---|
| Jan | 0.66 | 0.20 | -0.46 |
| Feb | 0.30 | 0.19 | -0.10 |
| Mar | 0.39 | 0.49 | 0.10 |
| Apr | 0.67 | 0.81 | 0.14 |
| May | 1.08 | 1.53 | 0.44 |
| Jun | 4.28 | 4.00 | -0.28 |
| Jul | 4.28 | 3.47 | -0.81 |
| Aug | 3.85 | 4.23 | 0.38 |
| Sep | 4.07 | 5.29 | 1.22 |
| Oct | 2.06 | 1.72 | -0.34 |
| Nov | 0.74 | 0.79 | 0.05 |
| Dec | 0.38 | 0.28 | -0.10 |
| ⌀ Month | 1.90 | 1.92 | 0.02 |
Snow (mm)
| Month | ⌀ 1940 - 1950 | ⌀ 2013 - 2023 | +/- |
|---|---|---|---|
| Jan | 0.00 | 0.00 | 0.00 |
| Feb | 0.00 | 0.00 | 0.00 |
| Mar | 0.00 | 0.00 | 0.00 |
| Apr | 0.00 | 0.00 | 0.00 |
| May | 0.00 | 0.00 | 0.00 |
| Jun | 0.00 | 0.00 | 0.00 |
| Jul | 0.00 | 0.00 | 0.00 |
| Aug | 0.00 | 0.00 | 0.00 |
| Sep | 0.00 | 0.00 | 0.00 |
| Oct | 0.00 | 0.00 | 0.00 |
| Nov | 0.00 | 0.00 | 0.00 |
| Dec | 0.00 | 0.00 | 0.00 |
| ⌀ Month | 0.00 | 0.00 | 0.00 |