Climate Change Chart of Nelspruit, South Africa
Comprehensive Climate Change Chart of Nelspruit, South Africa: Monthly Averages and Impact Trends
Exploring the climate change data for Nelspruit, South Africa reveals intriguing insights into the shifting weather patterns over the years.
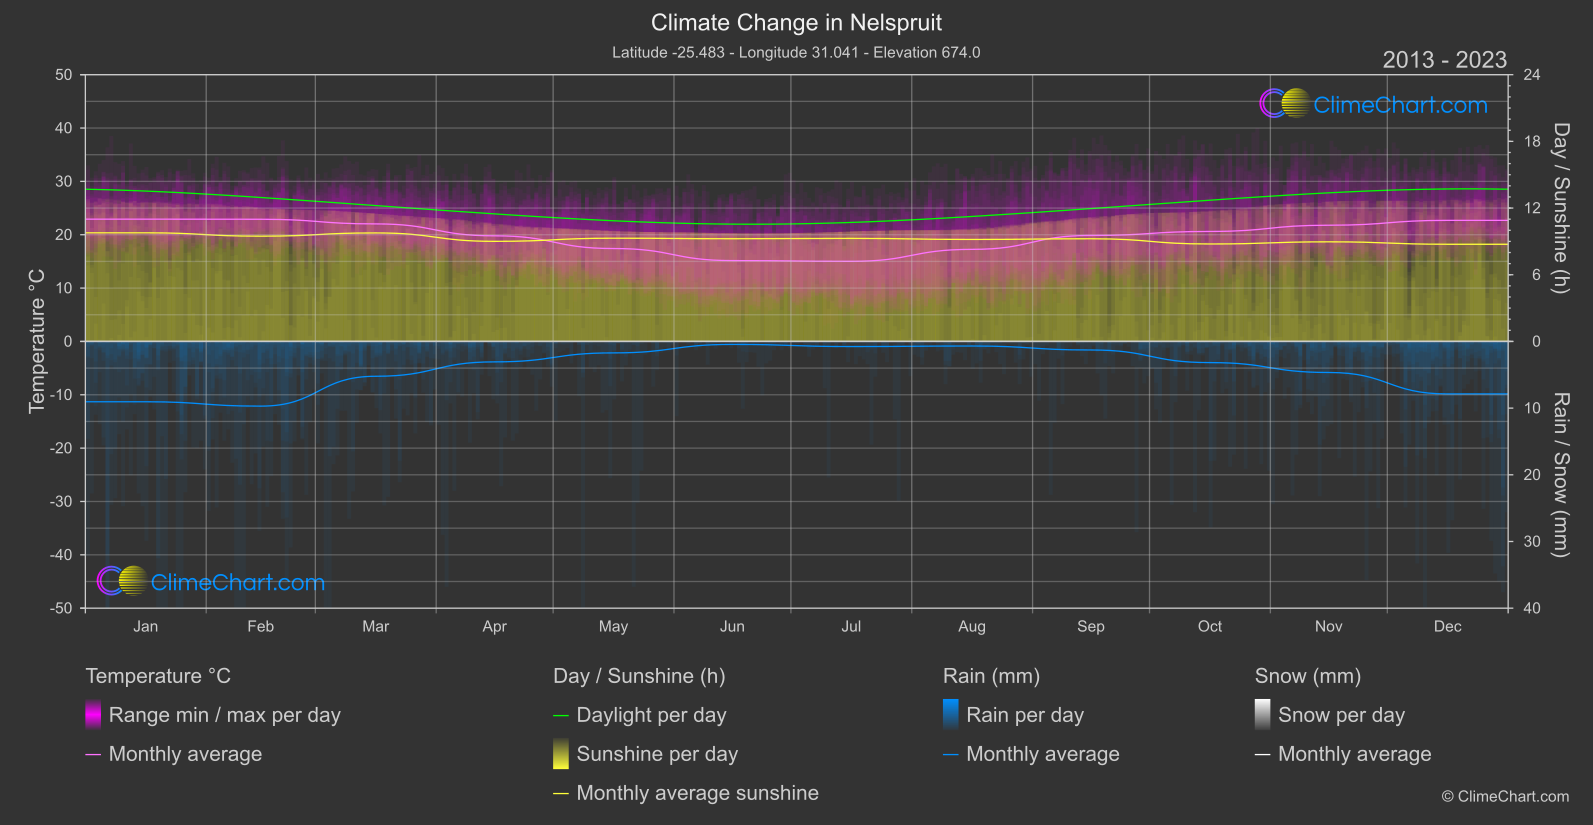
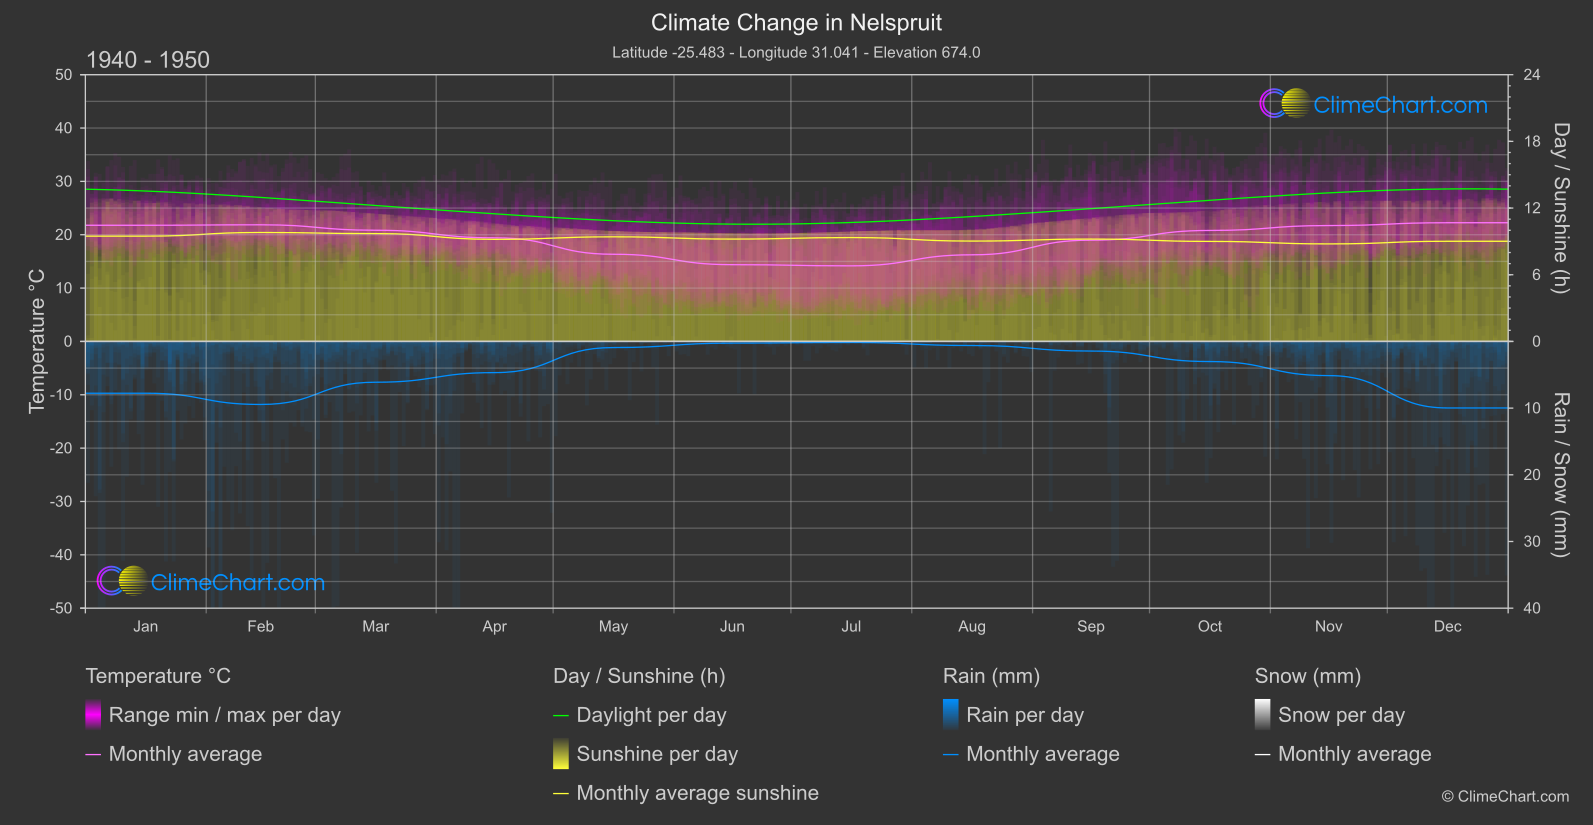
Nelspruit, located in South Africa, has experienced notable changes in temperature, rainfall, and sunshine duration over the years. Analyzing the data from 1940 to 1950 compared to 2013 - 2024, it is evident that certain months have shown significant shifts in weather patterns. For instance, the month of March has seen a substantial increase in both temperature and rainfall, indicating a trend towards warmer and wetter conditions. Conversely, October has experienced a slight decrease in temperature but a minimal change in rainfall. These insights provide valuable information for understanding the evolving climate in Nelspruit, South Africa.
Climate Change Data Overview for Nelspruit, South Africa
Explore the comprehensive climate change data for Nelspruit, South Africa. This detailed table provides valuable insights into temperature variations, precipitation levels, and seasonal changes influenced by climate change, helping you understand the unique weather patterns of this region.
Temperature °C
| Month | ⌀ 1940 - 1950 | ⌀ 2013 - 2023 | +/- |
|---|---|---|---|
| Jan | 21.77 | 22.92 | 1.15 |
| Feb | 21.86 | 22.90 | 1.04 |
| Mar | 20.84 | 22.03 | 1.19 |
| Apr | 19.42 | 19.79 | 0.37 |
| May | 16.34 | 17.41 | 1.08 |
| Jun | 14.39 | 15.15 | 0.76 |
| Jul | 14.17 | 15.01 | 0.84 |
| Aug | 16.24 | 17.26 | 1.02 |
| Sep | 18.98 | 19.86 | 0.88 |
| Oct | 20.80 | 20.62 | -0.19 |
| Nov | 21.72 | 21.78 | 0.06 |
| Dec | 22.25 | 22.69 | 0.45 |
| ⌀ Month | 19.07 | 19.79 | 0.72 |
Sunshine (h)
| Month | ⌀ 1940 - 1950 | ⌀ 2013 - 2023 | +/- |
|---|---|---|---|
| Jan | 9.48 | 9.77 | 0.30 |
| Feb | 9.80 | 9.47 | -0.33 |
| Mar | 9.70 | 9.76 | 0.06 |
| Apr | 9.19 | 9.01 | -0.18 |
| May | 9.41 | 9.29 | -0.12 |
| Jun | 9.21 | 9.24 | 0.03 |
| Jul | 9.35 | 9.27 | -0.08 |
| Aug | 9.03 | 9.18 | 0.15 |
| Sep | 9.21 | 9.24 | 0.03 |
| Oct | 9.00 | 8.77 | -0.23 |
| Nov | 8.77 | 8.96 | 0.19 |
| Dec | 9.01 | 8.74 | -0.27 |
| ⌀ Month | 9.26 | 9.22 | -0.04 |
Rain (mm)
| Month | ⌀ 1940 - 1950 | ⌀ 2013 - 2023 | +/- |
|---|---|---|---|
| Jan | 3.88 | 4.52 | 0.64 |
| Feb | 4.73 | 4.85 | 0.13 |
| Mar | 3.06 | 2.61 | -0.45 |
| Apr | 2.34 | 1.53 | -0.81 |
| May | 0.46 | 0.86 | 0.40 |
| Jun | 0.13 | 0.22 | 0.10 |
| Jul | 0.08 | 0.38 | 0.31 |
| Aug | 0.31 | 0.34 | 0.04 |
| Sep | 0.72 | 0.64 | -0.08 |
| Oct | 1.51 | 1.59 | 0.08 |
| Nov | 2.56 | 2.33 | -0.23 |
| Dec | 4.99 | 3.94 | -1.05 |
| ⌀ Month | 2.06 | 1.99 | -0.08 |
Snow (mm)
| Month | ⌀ 1940 - 1950 | ⌀ 2013 - 2023 | +/- |
|---|---|---|---|
| Jan | 0.00 | 0.00 | 0.00 |
| Feb | 0.00 | 0.00 | 0.00 |
| Mar | 0.00 | 0.00 | 0.00 |
| Apr | 0.00 | 0.00 | 0.00 |
| May | 0.00 | 0.00 | 0.00 |
| Jun | 0.00 | 0.00 | 0.00 |
| Jul | 0.00 | 0.00 | 0.00 |
| Aug | 0.00 | 0.00 | 0.00 |
| Sep | 0.00 | 0.00 | 0.00 |
| Oct | 0.00 | 0.00 | 0.00 |
| Nov | 0.00 | 0.00 | 0.00 |
| Dec | 0.00 | 0.00 | 0.00 |
| ⌀ Month | 0.00 | 0.00 | 0.00 |