Climate Change Chart of Nashville, USA
Comprehensive Climate Change Chart of Nashville, USA: Monthly Averages and Impact Trends
Explore the changing climate in Nashville, USA with insights from temperature, rainfall, snowfall, and sunshine duration data.
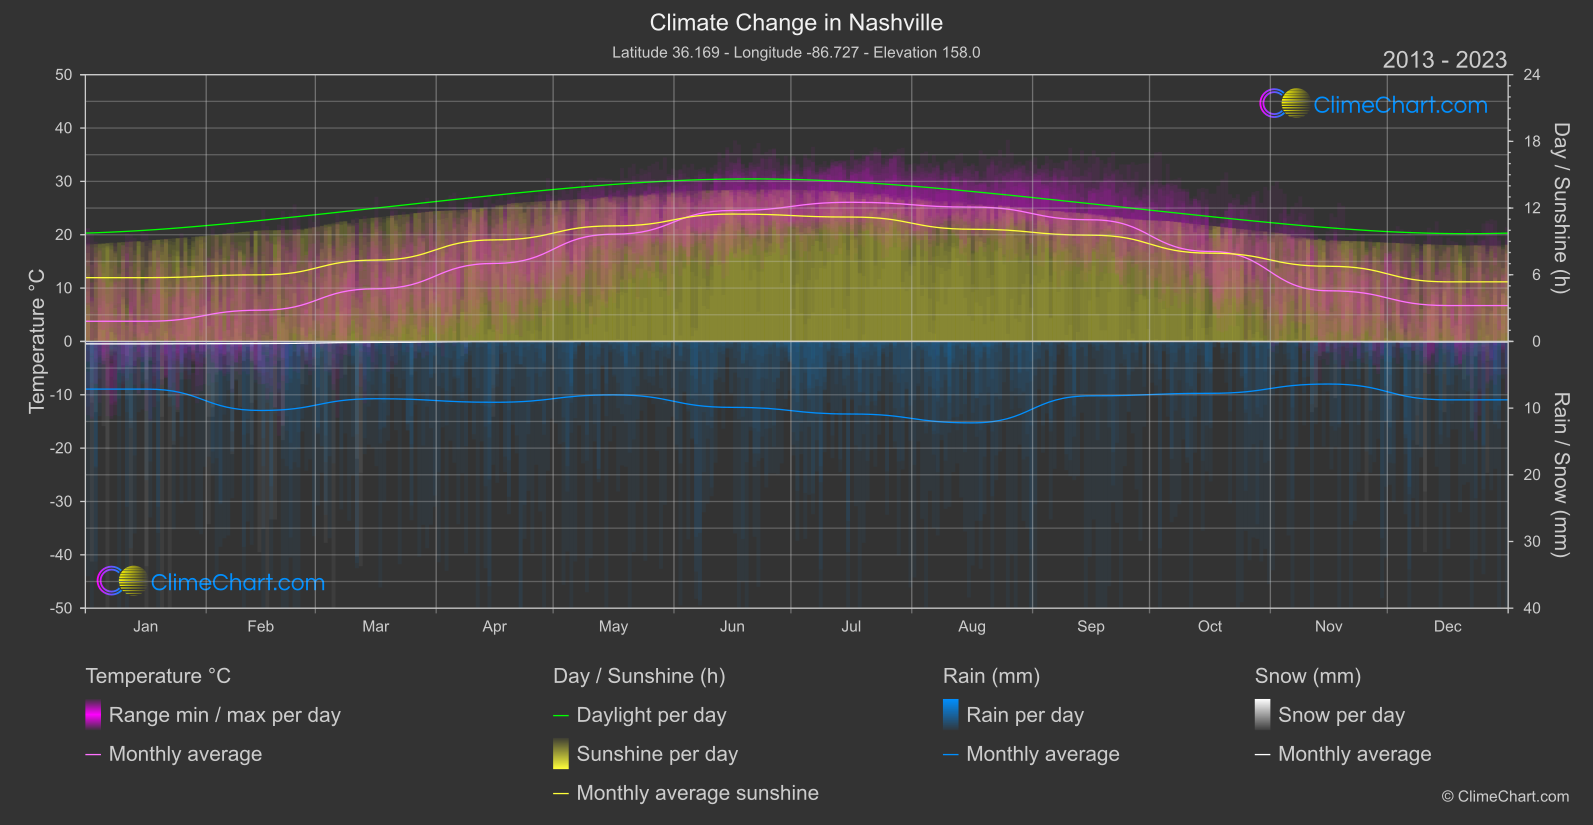
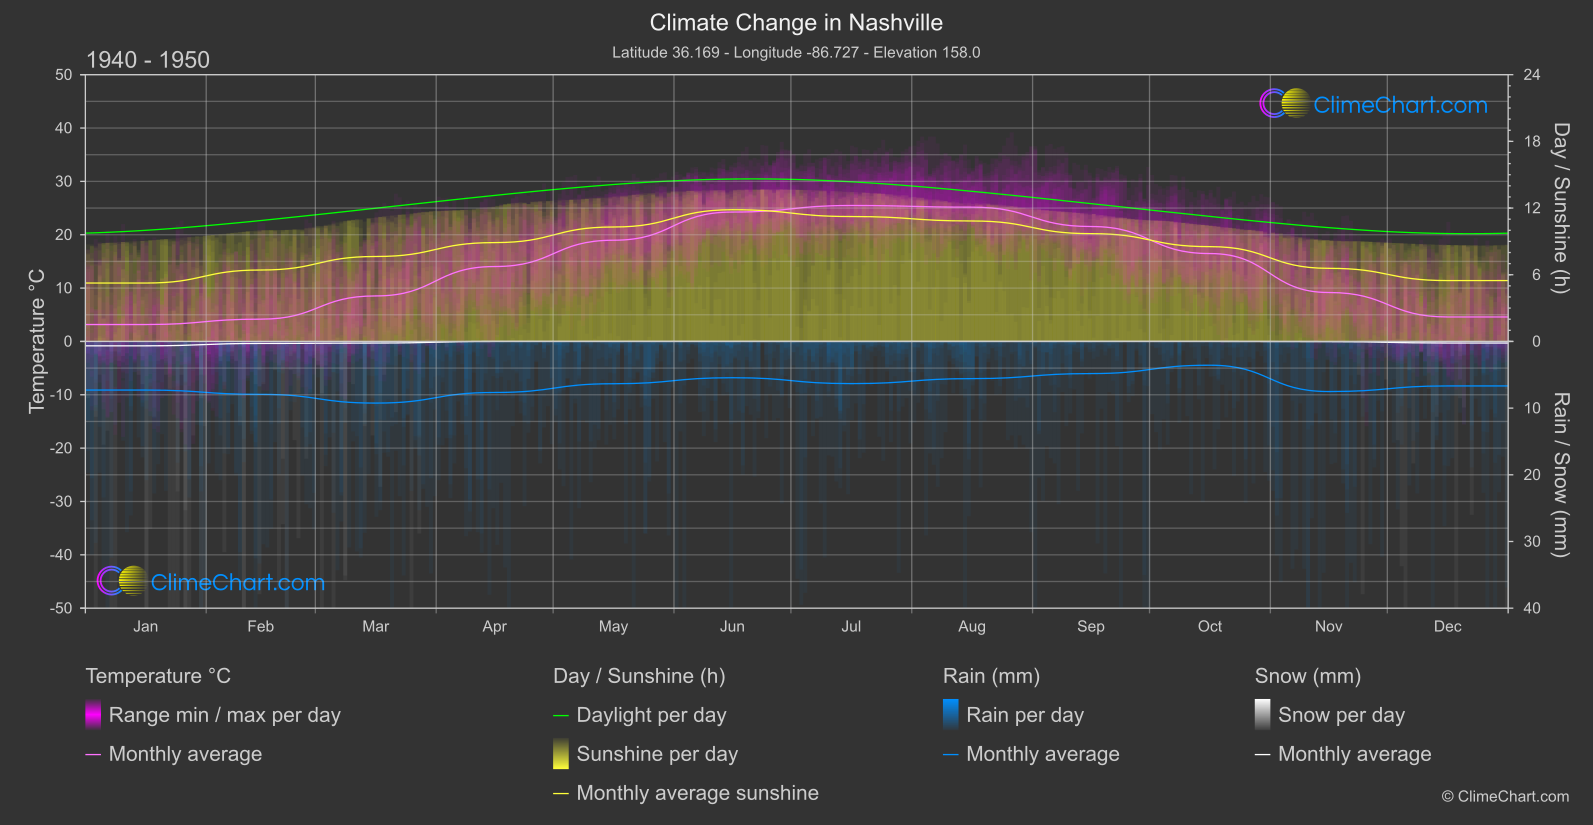
Nashville, USA, experiences varying climate patterns with notable changes in temperature, rainfall, snowfall, and sunshine duration. From the data analysis, it is evident that December shows the highest temperature change between the years, while August exhibits the most significant increase in rainfall. Moreover, snowfall remains minimal throughout the year, with no substantial changes observed. The sunshine duration fluctuates across the months, with January and October showcasing contrasting trends in sunshine hours.
Climate Change Data Overview for Nashville, USA
Explore the comprehensive climate change data for Nashville, USA. This detailed table provides valuable insights into temperature variations, precipitation levels, and seasonal changes influenced by climate change, helping you understand the unique weather patterns of this region.
Temperature °C
| Month | ⌀ 1940 - 1950 | ⌀ 2013 - 2023 | +/- |
|---|---|---|---|
| Jan | 3.17 | 3.78 | 0.61 |
| Feb | 4.17 | 5.86 | 1.68 |
| Mar | 8.53 | 9.87 | 1.34 |
| Apr | 14.04 | 14.62 | 0.59 |
| May | 18.97 | 20.09 | 1.12 |
| Jun | 24.25 | 24.55 | 0.30 |
| Jul | 25.48 | 26.08 | 0.60 |
| Aug | 25.17 | 25.18 | 0.01 |
| Sep | 21.54 | 22.80 | 1.26 |
| Oct | 16.47 | 16.87 | 0.39 |
| Nov | 9.17 | 9.50 | 0.33 |
| Dec | 4.59 | 6.72 | 2.14 |
| ⌀ Month | 14.63 | 15.49 | 0.86 |
Sunshine (h)
| Month | ⌀ 1940 - 1950 | ⌀ 2013 - 2023 | +/- |
|---|---|---|---|
| Jan | 5.25 | 5.74 | 0.48 |
| Feb | 6.43 | 5.99 | -0.43 |
| Mar | 7.64 | 7.32 | -0.32 |
| Apr | 8.89 | 9.14 | 0.24 |
| May | 10.30 | 10.40 | 0.10 |
| Jun | 11.85 | 11.46 | -0.39 |
| Jul | 11.24 | 11.19 | -0.05 |
| Aug | 10.84 | 10.09 | -0.74 |
| Sep | 9.70 | 9.56 | -0.14 |
| Oct | 8.53 | 7.94 | -0.58 |
| Nov | 6.58 | 6.76 | 0.19 |
| Dec | 5.47 | 5.36 | -0.11 |
| ⌀ Month | 8.56 | 8.41 | -0.15 |
Rain (mm)
| Month | ⌀ 1940 - 1950 | ⌀ 2013 - 2023 | +/- |
|---|---|---|---|
| Jan | 3.65 | 3.57 | -0.07 |
| Feb | 3.97 | 5.18 | 1.21 |
| Mar | 4.62 | 4.30 | -0.33 |
| Apr | 3.83 | 4.56 | 0.73 |
| May | 3.17 | 4.01 | 0.84 |
| Jun | 2.72 | 4.94 | 2.22 |
| Jul | 3.16 | 5.44 | 2.28 |
| Aug | 2.79 | 6.11 | 3.32 |
| Sep | 2.41 | 4.08 | 1.67 |
| Oct | 1.78 | 3.89 | 2.11 |
| Nov | 3.76 | 3.19 | -0.56 |
| Dec | 3.34 | 4.38 | 1.04 |
| ⌀ Month | 3.27 | 4.47 | 1.20 |
Snow (mm)
| Month | ⌀ 1940 - 1950 | ⌀ 2013 - 2023 | +/- |
|---|---|---|---|
| Jan | 0.33 | 0.18 | -0.15 |
| Feb | 0.15 | 0.16 | 0.01 |
| Mar | 0.12 | 0.07 | -0.05 |
| Apr | 0.00 | 0.00 | 0.00 |
| May | 0.00 | 0.00 | 0.00 |
| Jun | 0.00 | 0.00 | 0.00 |
| Jul | 0.00 | 0.00 | 0.00 |
| Aug | 0.00 | 0.00 | 0.00 |
| Sep | 0.00 | 0.00 | 0.00 |
| Oct | 0.00 | 0.00 | 0.00 |
| Nov | 0.02 | 0.02 | 0.01 |
| Dec | 0.12 | 0.04 | -0.08 |
| ⌀ Month | 0.06 | 0.04 | -0.02 |