Climate Change Chart of Nafplio, Greece
Comprehensive Climate Change Chart of Nafplio, Greece: Monthly Averages and Impact Trends
Explore the changing climate in Nafplio, Greece with insightful data analysis. Discover how temperatures, rainfall, snowfall, and sunshine duration have evolved from 1940-1950 to 2013-2024.
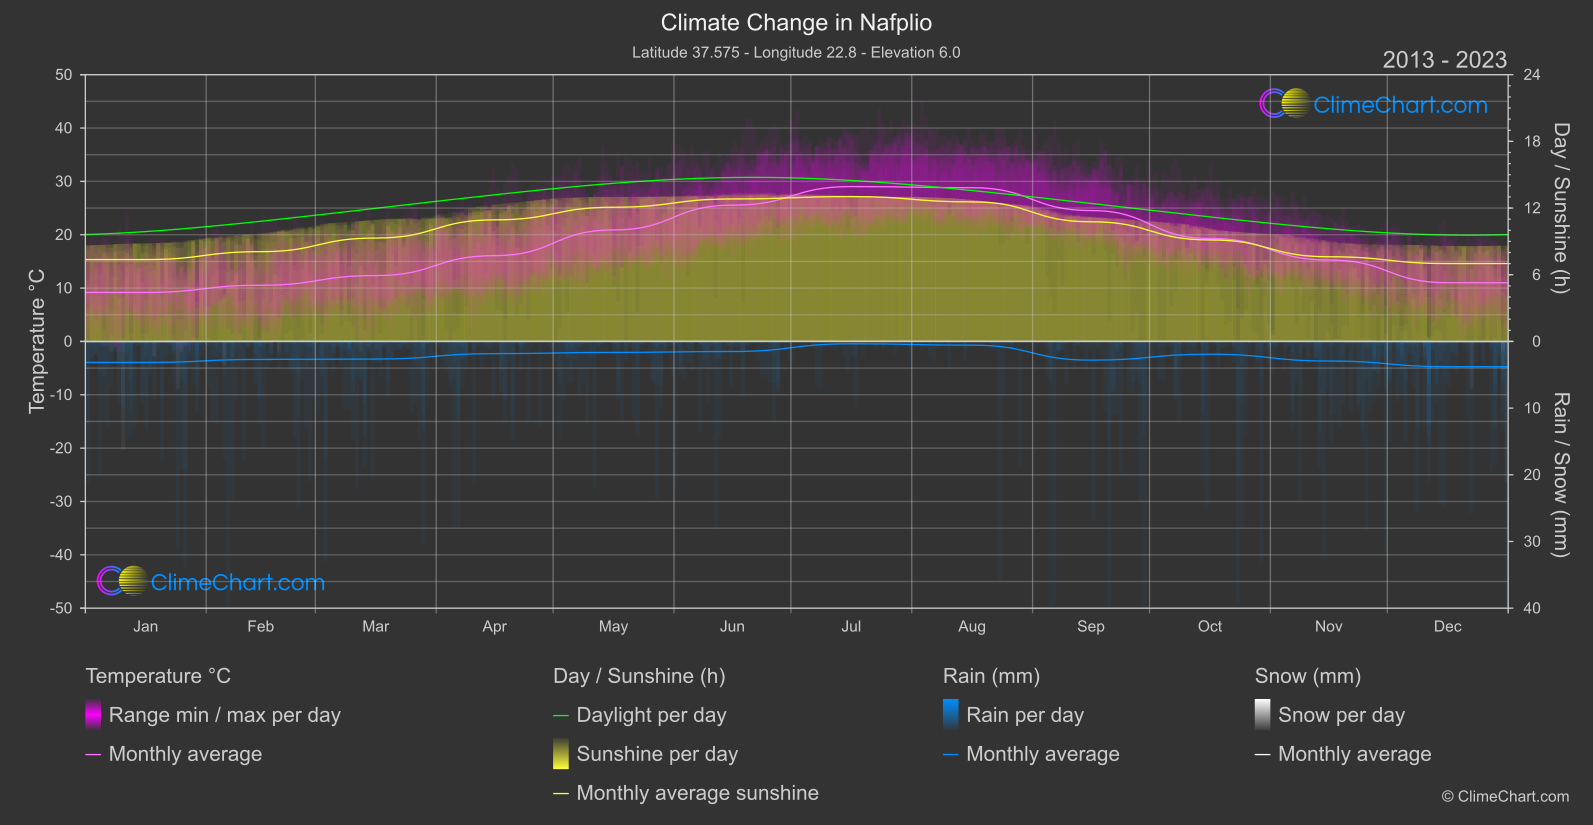
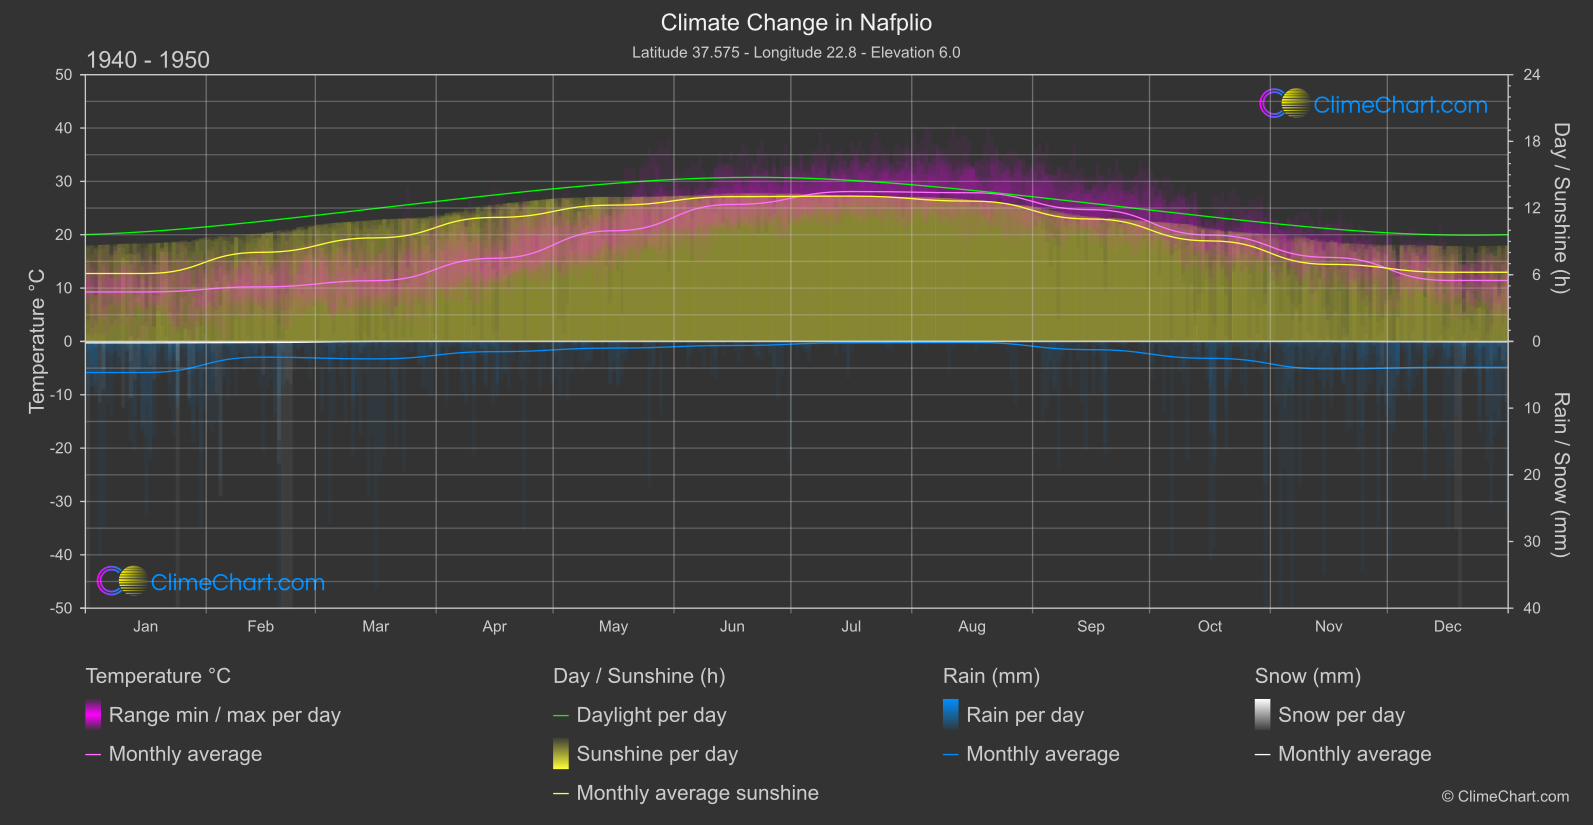
Nafplio, Greece experiences varying climate patterns with notable changes in temperature, rainfall, snowfall, and sunshine duration. The data from 1940-1950 compared to 2013-2024 reveals interesting insights. For instance, the month of July saw a significant increase in temperature by 0.93°C, while September experienced a decrease of 0.17°C. In terms of rainfall, September recorded the highest change of 78.58% with an increase in precipitation. Snowfall, on the other hand, remained minimal with negligible changes over the years. The sunshine duration showed fluctuations with notable differences in various months, such as December witnessing a rise of 0.78 hours of sunshine. These trends reflect the evolving climate dynamics in Nafplio, highlighting the impact of climate change on this region.
Climate Change Data Overview for Nafplio, Greece
Explore the comprehensive climate change data for Nafplio, Greece. This detailed table provides valuable insights into temperature variations, precipitation levels, and seasonal changes influenced by climate change, helping you understand the unique weather patterns of this region.
Temperature °C
| Month | ⌀ 1940 - 1950 | ⌀ 2013 - 2023 | +/- |
|---|---|---|---|
| Jan | 9.27 | 9.18 | -0.09 |
| Feb | 10.24 | 10.53 | 0.30 |
| Mar | 11.39 | 12.34 | 0.95 |
| Apr | 15.59 | 16.08 | 0.50 |
| May | 20.74 | 20.90 | 0.15 |
| Jun | 25.68 | 25.54 | -0.13 |
| Jul | 28.10 | 29.03 | 0.93 |
| Aug | 27.87 | 28.82 | 0.94 |
| Sep | 24.70 | 24.53 | -0.17 |
| Oct | 19.95 | 19.30 | -0.65 |
| Nov | 15.75 | 15.26 | -0.49 |
| Dec | 11.43 | 11.00 | -0.43 |
| ⌀ Month | 18.39 | 18.54 | 0.15 |
Sunshine (h)
| Month | ⌀ 1940 - 1950 | ⌀ 2013 - 2023 | +/- |
|---|---|---|---|
| Jan | 6.11 | 7.37 | 1.25 |
| Feb | 8.02 | 8.08 | 0.06 |
| Mar | 9.32 | 9.30 | -0.02 |
| Apr | 11.16 | 10.94 | -0.22 |
| May | 12.27 | 12.07 | -0.19 |
| Jun | 13.03 | 12.82 | -0.21 |
| Jul | 13.07 | 13.03 | -0.04 |
| Aug | 12.62 | 12.56 | -0.07 |
| Sep | 11.01 | 10.76 | -0.25 |
| Oct | 9.04 | 9.13 | 0.09 |
| Nov | 6.93 | 7.62 | 0.69 |
| Dec | 6.22 | 7.01 | 0.78 |
| ⌀ Month | 9.90 | 10.06 | 0.16 |
Rain (mm)
| Month | ⌀ 1940 - 1950 | ⌀ 2013 - 2023 | +/- |
|---|---|---|---|
| Jan | 2.33 | 1.58 | -0.75 |
| Feb | 1.18 | 1.35 | 0.17 |
| Mar | 1.31 | 1.32 | 0.01 |
| Apr | 0.77 | 0.91 | 0.15 |
| May | 0.50 | 0.82 | 0.32 |
| Jun | 0.31 | 0.75 | 0.45 |
| Jul | 0.10 | 0.18 | 0.07 |
| Aug | 0.08 | 0.28 | 0.20 |
| Sep | 0.62 | 1.40 | 0.79 |
| Oct | 1.27 | 0.96 | -0.31 |
| Nov | 2.06 | 1.47 | -0.59 |
| Dec | 1.94 | 1.89 | -0.05 |
| ⌀ Month | 1.04 | 1.08 | 0.04 |
Snow (mm)
| Month | ⌀ 1940 - 1950 | ⌀ 2013 - 2023 | +/- |
|---|---|---|---|
| Jan | 0.11 | 0.01 | -0.10 |
| Feb | 0.08 | 0.00 | -0.08 |
| Mar | 0.00 | 0.00 | 0.00 |
| Apr | 0.00 | 0.00 | 0.00 |
| May | 0.00 | 0.00 | 0.00 |
| Jun | 0.00 | 0.00 | 0.00 |
| Jul | 0.00 | 0.00 | 0.00 |
| Aug | 0.00 | 0.00 | 0.00 |
| Sep | 0.00 | 0.00 | 0.00 |
| Oct | 0.00 | 0.00 | 0.00 |
| Nov | 0.00 | 0.00 | -0.00 |
| Dec | 0.03 | 0.01 | -0.02 |
| ⌀ Month | 0.02 | 0.00 | -0.02 |